Support and resistance are the backbone of discretionary price action trading. A support and resistance forex strategy organizes market structure into tradable zones where buyers and sellers repeatedly respond. These zones are not exact lines; they are areas where supply and demand rebalance. Effective execution requires clarity about context, waiting for candle closes relative to the zone, and combining static levels with dynamic tools and price action triggers. This guide explains how to define and prioritize zones, trade bounce and break-retest setups through manual execution, incorporate psychological and moving-average levels, manage risk around liquidity, and adapt the approach across timeframes.
New to Elirox? Learn how the platform works before applying these strategies: What is Elirox and how does it work.
Support marks a zone where demand historically absorbs supply and price tends to stabilize or bounce. Resistance marks a zone where supply historically absorbs demand and price stalls or reverses. In practice, these are horizontal areas derived from swing highs/lows, consolidation bases, and prior reaction zones. Always treat them as zones, not precise lines. The true test is how candles close relative to the zone: a rejection close within/away from the zone often signals continuation or reversal, while a decisive close through the zone signals potential transition.
A robust key levels forex strategy prioritizes:
Static levels are horizontal zones mapped from visible structures: swing highs/lows, double tops/bottoms, consolidation edges, and gap boundaries. They do not move until new market structure forms. Advantages: clarity and objectivity across traders. Limitations: in strong trends, static counter‑zones can be overrun temporarily as price seeks liquidity beyond the edges.
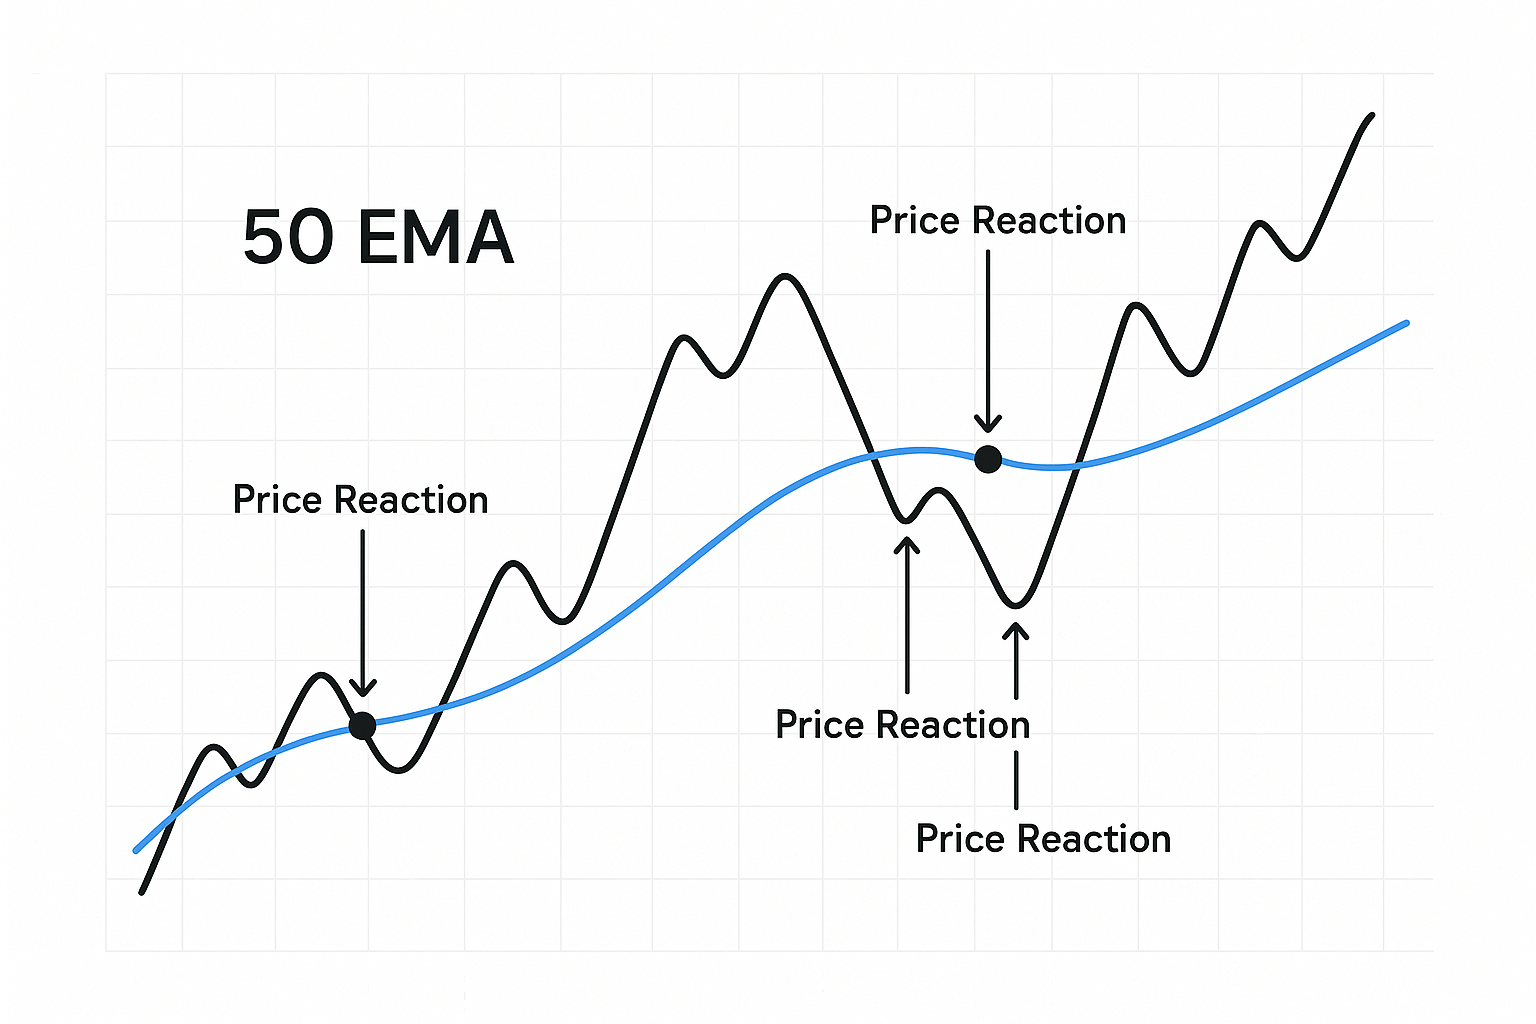
Dynamic levels shift with price. The most common are moving averages (e.g., 50/100/200 SMA/EMA) that often behave as support in uptrends and resistance in downtrends. Advantages: they adapt to trend strength and can highlight momentum pullback areas. Limitations: they are derived from past data (lagging) and can whipsaw in ranges. Neither static nor dynamic levels are sufficient alone; use both, but let price action and candle closes relative to the zone confirm intent. In ranges, prioritize static horizontal zones. In trends, weigh dynamic levels more heavily—especially when they align with a nearby horizontal zone.
Round numbers such as 1.2000 in EUR/USD or 150.00 in USD/JPY act as magnets where orders cluster. These “big figures,” halves (.50), and quarters (.25/.75) attract institutional flows, options barriers, and retail stops. Treat these as wide zones—price may overshoot temporarily to harvest stops before reverting. Practical handling:
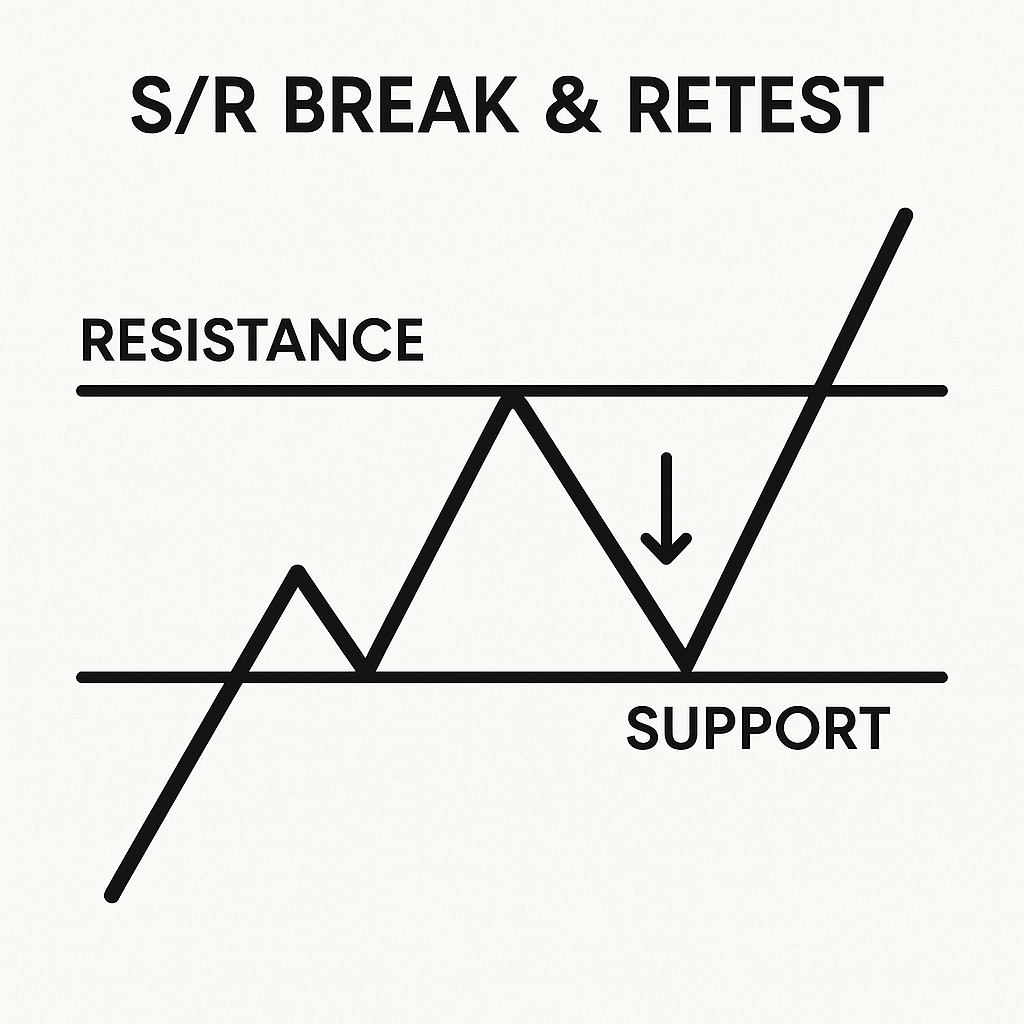
Most discretionary trades around S/R fall into two categories: fading a zone (bounce) or joining trend continuation after a decisive break (break and retest). In both, the key rule applies: S/R are zones, and you should base decisions on candle closes relative to the zone. Generally, break‑retest trades are safer than attacking breakouts head‑on because they use the Polarity Principle—broken resistance acting as support (and vice versa)—to validate intent and refine risk.
Ready to apply S/R levels in live trading? Here’s how to get started on Elirox: How to start trading with Elirox.
| Checklist item | What to confirm |
|---|---|
| Zone quality | Clear horizontal area with multiple clean tests and visible reactions; drawn from higher timeframe when possible. |
| Context | Trending or ranging environment; align strategy (bounce in range, break‑retest in trend). |
| Confluence | Round numbers, prior swing structure, and/or dynamic levels clustering near the zone. |
| Candle close signal | Rejection close for bounces; strong close beyond zone for breaks; avoid acting on wicks alone. |
| Trigger pattern | Pin bar/engulfing/inside‑bar break for bounce; retest rejection or micro‑structure shift for break‑retest. |
| Risk plan | Stop behind the zone with buffer; position size to account for buffer. |
| Invalidation | Clear criteria for when the idea is wrong (clean close through the opposite side of the zone). |
| Targets | Next structure level(s); use partials and/or trailing behind swings/MAs in trend. |
The s/r bounce strategy attempts to fade price as it reacts off a well‑defined zone. It works best in ranges or during corrective moves into a strong higher‑timeframe level. Execution steps:
Context tips:
Breakouts that close decisively beyond a zone often transition market structure. Rather than chase the breakout, waiting for a retest into the broken zone is typically safer than trading breakouts head‑on. The Polarity Principle suggests resistance becomes support (and vice versa), offering a favorable entry with defined risk.
Execution steps:
Key nuances:
Dynamic tools can add timing and structure to discretionary setups, especially in trends. The phrase dynamic support resistance ma forex refers to using moving averages as context providers rather than primary signals. When a horizontal zone aligns with a sloping MA in a trend, the overlap often tightens entries, reduces stop distance relative to reward, and clarifies invalidation. Still, because moving averages lag, always prioritize price action and candle closes around zones.
Integration guidelines:
Moving averages such as the 50, 100, and 200 are widely watched by market participants. In clear uptrends, price often respects the rising 50 or 100 as dynamic support; in downtrends, the falling 50 or 100 may cap pullbacks as dynamic resistance. The 200 commonly frames the larger trend regime.
Practical usage:
Caveats:
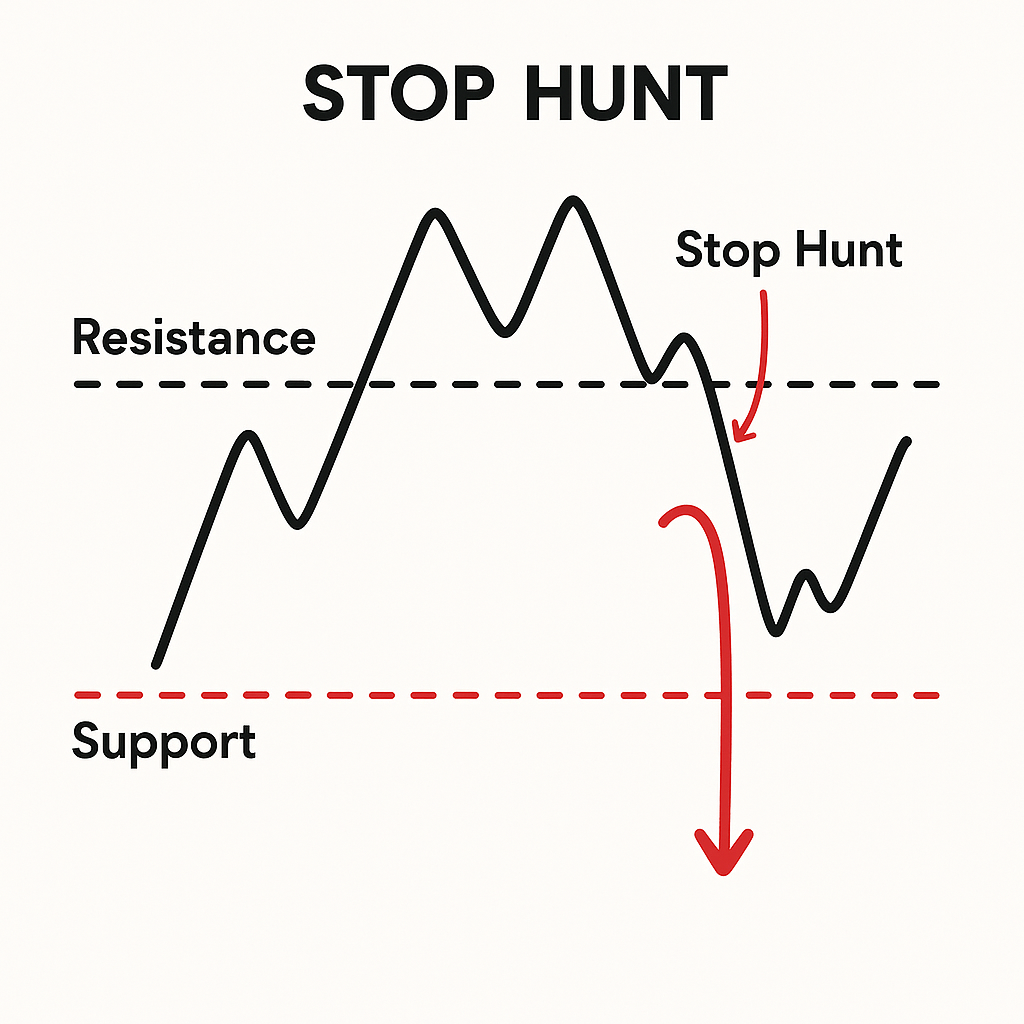
Liquidity concentrates around obvious S/R zones, prior highs/lows, and round numbers. Large players often need that liquidity to execute or unwind positions. As a result, price frequently wicks beyond a zone to trigger clustered stops and pending orders before moving in the intended direction. Understanding this mechanism helps explain why stops placed exactly “on the line” are vulnerable—and why confirmation by closes and buffered stops is essential.
Liquidity pools form where many traders agree on levels. Around horizontal zones and big figures, resting orders and stop losses accumulate. A typical sequence: price accelerates into the level, wicks beyond it (stop hunt), fills resting orders, then reverses and closes back inside/away from the zone. This behavior is not random; it’s a function of how markets source liquidity.
Implications for execution:
Using the liquidity lens refines patience: you let the market show its hand via closes rather than reacting to the first spike.
Correct s/r stop loss placement is a primary defense against liquidity sweeps. The principle is straightforward: stops go behind the relevant side of the zone, not on the level. Add a volatility buffer based on the instrument’s recent trading range so routine fluctuations don’t tag your stop.
Practical guidelines:
Common mistakes to avoid:
Top‑down analysis is essential. Map major zones on the Daily/H4 to define bias and key reaction areas. Then, refine entries on the H1/M15 using price action. Higher‑timeframe zones tend to be wider and more reliable; lower timeframes provide precision for triggers and stop placement. Even when executing on a faster chart, respect what higher‑timeframe candles are doing relative to the same zone—those closes carry more weight.
S/R on the fastest charts is subject to noise, while higher‑timeframe zones offer durability. In s/r scalping, traders attempt to capture small moves reacting to intraday levels. The approach relies on crisp execution, immediate rejection evidence, and tight, ATR‑aware buffers because minute‑chart wicks frequently sweep obvious lines. Confluence with a higher‑timeframe zone improves the odds substantially; without it, expect more false signals and be prepared to exit quickly if the candle closes through the zone.
In contrast, s/r swing trading prioritizes H4/Daily zones that have multiple clean tests and clear reactions. Swing entries often come from a lower timeframe but are validated by higher‑timeframe closes relative to the zone. The benefits include:
Bridging the two:
A support and resistance forex strategy hinges on reading zones, not lines, and letting candle closes relative to those zones guide decisions. The more times a zone is tested with reaction, the more significant it becomes—until a decisive close transitions structure. In ranges, fade bounces with confirmation; in trends, favor the safer break‑and‑retest over chasing breakouts. Psychological round numbers and dynamic tools add confluence, but price action around the zone remains decisive. Protect capital by placing stops behind the level with a volatility buffer and by defining invalidation in advance. Applied across timeframes with top‑down context, S/R provides a disciplined, repeatable framework for trade selection, timing, and risk management.
Want to explore automated trading strategies in a risk-free environment first? Start with $10,000 in virtual funds: How to use a demo account.