Before you place a single trade with Ichimoku, define your objective: capture sustained, directional movement and avoid noise. The Ichimoku forex strategy is built as a complete, trend-following framework that integrates momentum, support/resistance (S/R), and timing into one view. Used correctly, it helps you find confluence, manage risk consistently, and stay with winners—while helping you avoid many low-quality signals in ranging markets.
Ichimoku Kinko Hyo is a comprehensive, trend-following system created to evaluate market equilibrium “at a glance.” Rather than relying on a single line or oscillator, it layers five components to describe trend direction, momentum shifts, and dynamic support/resistance zones. In trending conditions, the system can keep you aligned with the path of least resistance; in ranging conditions, it often produces conflicting or lagging signals that suggest standing aside.
Key principle: Ichimoku is a trend indicator. Inside the Kumo (Cloud) or during sideways movement, signals are unreliable and often false. The system is most effective when you wait for clean breaks, alignment across components, and confirmation that price has moved out of equilibrium into trend.
💡 Ichimoku tells you the trend. Elirox keeps you in it.
Trend following works — but manually managing positions across sessions is exhausting. Elirox lets you run systematic bots aligned with your trend bias, executing entries and managing positions automatically. No VPS, no coding. Try Elirox for free.
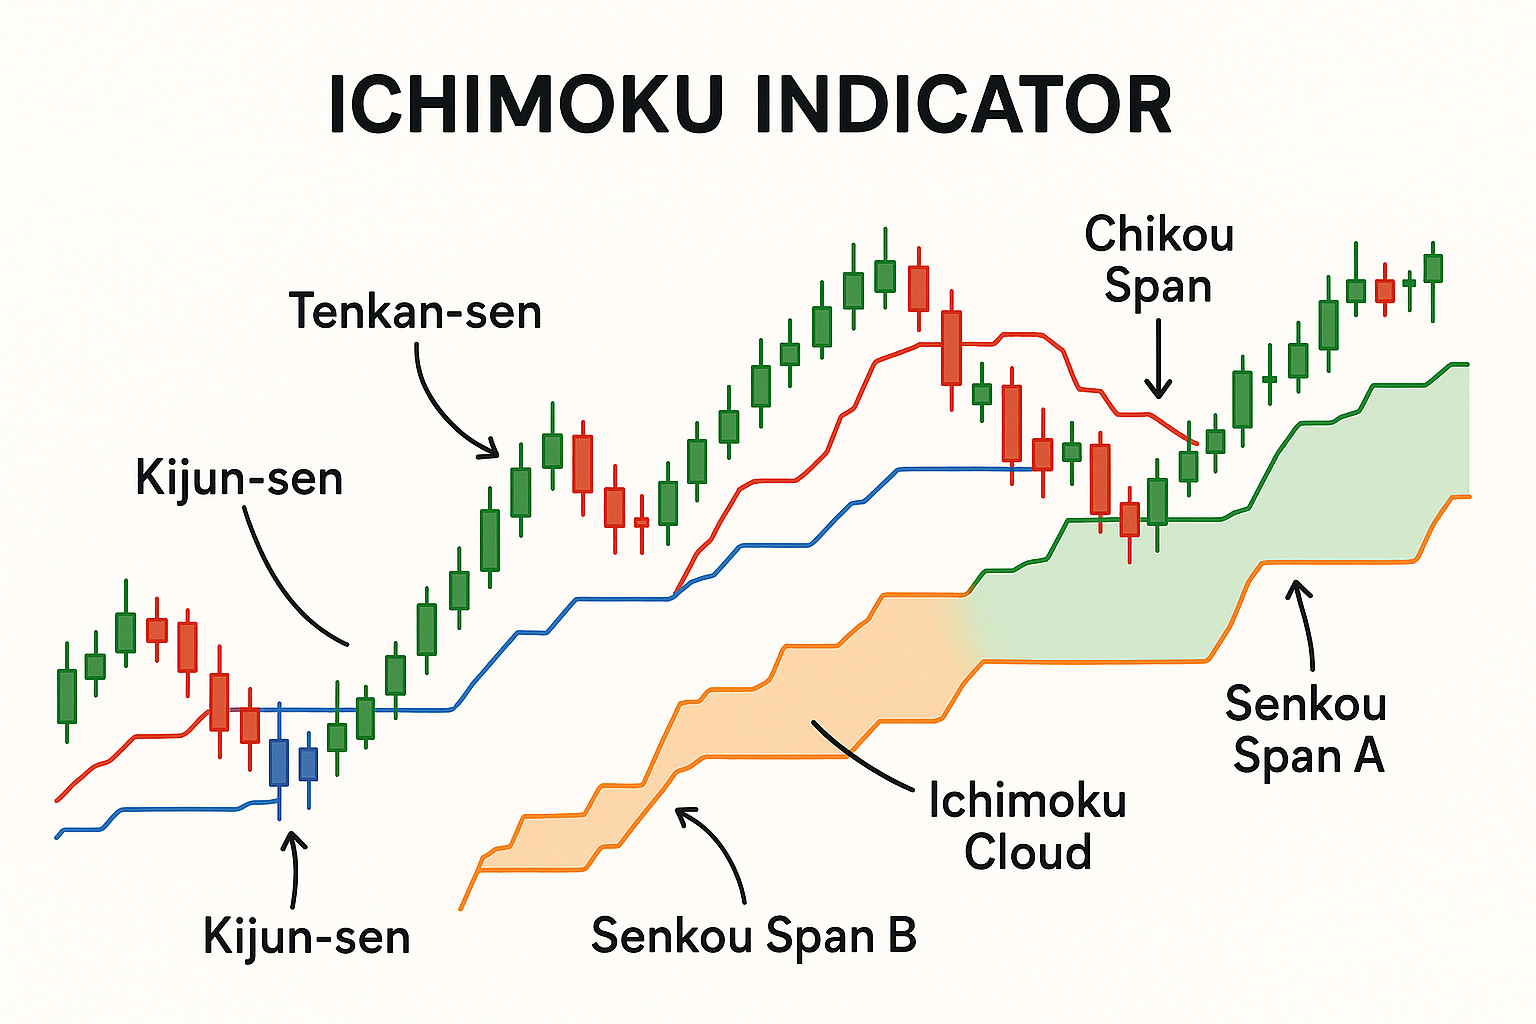
Ichimoku comprises five plotted elements. Understanding the objective role of each is essential before combining them into a trading plan.
Important: Treat the Kumo as a zone, not an exact line. Because it is forward-shifted and derived from median levels, its real utility is as a dynamic support/resistance area that adapts to volatility and trend.
The classic settings—9, 26, 52—map to historical Japanese trading calendars: approximately a week-and-a-half (9), one trading month (26), and two months (52). In 24/5 FX markets, these settings remain a common default and preserve the intended relationships between fast, medium, and slow equilibrium.
Most forex traders keep 9/26/52 as the baseline. Adjustments (e.g., 10/30/60) are sometimes used to align with custom sessions, but changing one parameter alters the behavior of all components. For consistency and comparability, use standard Ichimoku settings forex unless you have tested alternatives thoroughly.
The Cloud is the backbone of Ichimoku trend assessment and trade selection. It visualizes equilibrium and projects potential S/R into the future.
Risk reminder: In or near the Kumo, conditions are indecisive. Signals taken inside the Cloud are more prone to failure and should generally be avoided. If you must trade within or near the Cloud, reduce size and use tight, structure-based stops.
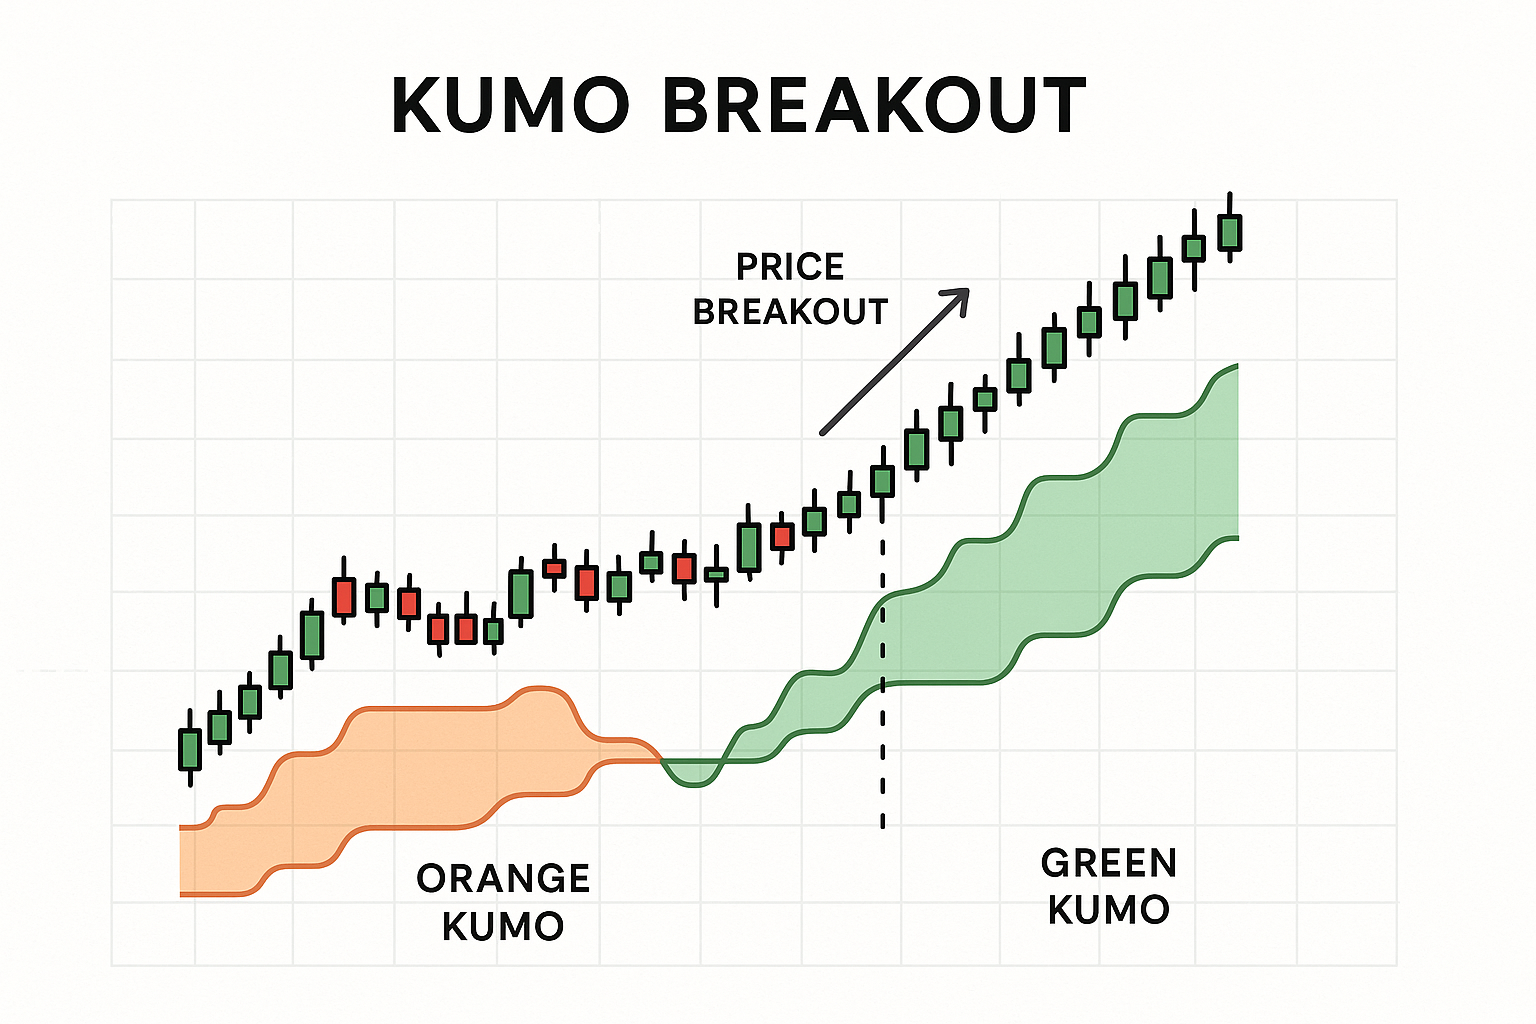
The kumo breakout strategy aims to capture the moment price exits equilibrium and transitions into a directional leg.
Core rules for a bullish breakout:
Bearish breakouts invert these conditions: price closes below the Kumo, forward Cloud turns bearish, Tenkan < Kijun, and Chikou below past price action. Manage stops above the nearest Cloud edge or above Kijun.
Why breakouts matter: Equilibrium gives way to trend at the Cloud boundary. When multiple components align, the breakout can mark the beginning of a more productive part of the move.
A Tenkan-Kijun cross is similar in spirit to moving-average crossovers but is grounded in equilibrium rather than pure averaging. It provides a timing cue, but the strength of the signal depends heavily on its location relative to the Cloud.
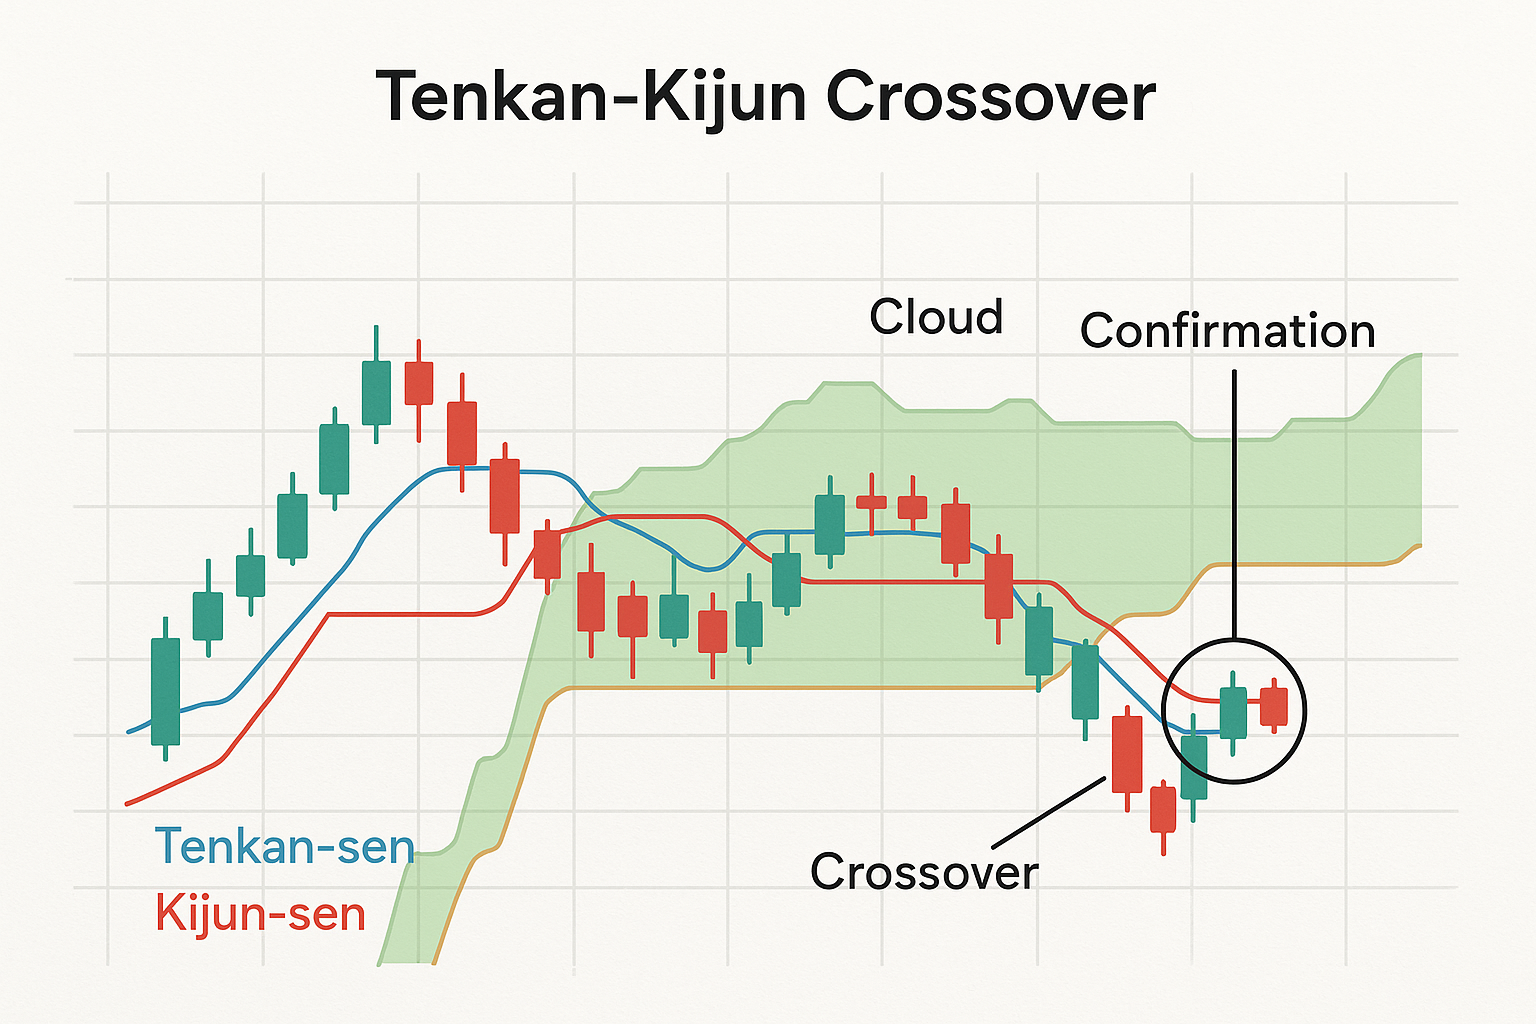
Use the cross as a trigger, not a standalone decision point. The best trades occur when the cross happens in the direction of the prevailing trend and away from noisy, sideways conditions. If the market is ranging—especially inside the Kumo—expect frequent, low-quality crosses.
Risk management note: If you trade a cross, anchor your stop beyond Kijun or the nearest Kumo edge. This keeps your invalidation aligned with medium-term structure rather than arbitrary pips.
Signal strength is a function of where the cross occurs relative to the Cloud and in which direction:
Bearish signals invert the logic. The cloud’s location and slope filter crosses, helping you avoid chasing momentum against structure.
The Chikou Span provides a clean view of where current price sits relative to historical structure by plotting today’s price 26 periods in the past. This temporal offset allows for an at-a-glance read: has price convincingly cleared the prior trading range, or is it still entangled inside old support/resistance?
Chikou excels at filtering trades. If a Tenkan-Kijun cross fires but Chikou is still jammed into old consolidation, concede the ambiguity and wait. You will miss some early entries, but you will also reduce exposure to flat-market traps.
Risk discipline: Treat Chikou as a veto when it clashes with your other signals. Waiting for Chikou to clear structure can be the difference between a higher-quality trend trade and a whipsaw.
A high-quality Ichimoku entry is an alignment of Cloud, cross, and Chikou—each validating the same directional bias. This confluence supports ichimoku trend following by aligning multiple signals in the same direction.
Bullish confluence checklist:
Entry and execution:
Bearish confluence is the mirror image.
| Signal Type | Signal Strength | Confirmation Status |
|---|---|---|
| Tenkan-Kijun Cross | Weak | Cross occurs countertrend (e.g., above Kumo for bearish, below Kumo for bullish) or inside a flat Kumo |
| Tenkan-Kijun Cross | Medium | Cross occurs inside the Kumo with improving Cloud slope or pending breakout |
| Tenkan-Kijun Cross | Strong | Cross occurs in the direction of trend while price is outside the Kumo with bullish/bearish forward Cloud |
| Kumo Breakout | Weak | Breakout against forward Cloud color or with flat/indecisive spans |
| Kumo Breakout | Medium | Breakout with neutral forward Cloud and mixed momentum |
| Kumo Breakout | Strong | Breakout aligned with forward Cloud color and slope; retest holds |
| Chikou Position | Weak | Chikou still inside prior price range or inside the Kumo |
| Chikou Position | Medium | Chikou barely above/below prior price action but still near congestion |
| Chikou Position | Strong | Chikou clearly above/below prior price action and outside the Kumo |
Practical filters:
Ichimoku trend following is where the system shines. Once you have confluence and a clear break from equilibrium:
Always pair trend following with risk control. Set initial Stop Loss at Kijun or the nearest Cloud edge and size positions so that a structurally sound stop still fits your risk budget.
Timeframe defines the balance between noise and signal. Ichimoku adapts across charts, but its reliability increases as you move higher.
Session timing is especially important for shorter timeframes — trading hours vary by broker and instrument, and Ichimoku signals on low timeframes are most reliable during liquid sessions (London, NY overlap).
Risk warning: Inside or near the Kumo on low timeframes, signals degrade rapidly. If conditions look choppy or the Cloud is flat, stand aside.
Weekly charts can guide macro bias; intraday charts (15M–1H) can fine-tune entries, provided they respect the higher-timeframe trend and Cloud structure.
Adding Ichimoku is straightforward on the main retail platforms:
Tip: Save an Ichimoku template with your preferred colors and line weights. Consistent visuals improve your ability to read the chart at a glance.
The Ichimoku forex strategy is a complete, trend-oriented framework designed to align entries, manage risk, and keep you on the right side of sustained moves. Its value comes from confluence: the Kumo establishes trend and dynamic support/resistance, the Tenkan-Kijun cross provides timing, and the Chikou Span confirms clearance from prior structure. Respect the system’s boundaries — avoid trading inside the Cloud, view the Kumo as a zone rather than an exact line, and size positions so a stop beyond Kijun or the nearest Cloud edge fits your plan.
Markets spend long stretches ranging; Ichimoku highlights when conditions are indecisive and rewards patience when a breakout develops into trend. Combine disciplined risk management with structured confirmations, and you’ll leverage Ichimoku as intended: an objective, all-in-one method for identifying, entering, and managing high-quality directional trades. New to the platform? Start on a demo account with $10,000 in virtual funds before going live.