Fibonacci retracement is a tool used to measure where a trending market might correct before resuming its move. It projects percentage pullback zones between a clearly defined Swing High and Swing Low. Traders use these zones to identify potential reaction areas, then validate them with price action and market structure.
A retracement tool divides the prior impulsive leg by key ratios (for example, 38.2%, 50%, 61.8%, 78.6%) to estimate where buyers or sellers may step back in. Because price can overshoot or ignore any single level—especially during strong momentum—Fibonacci should support, not replace, confirmation from support/resistance, trendlines, and candlestick context. A Stop Loss remains mandatory on every trade.
💡 You know the levels. Now automate what happens at them.
Fibonacci gives you the zones. Elirox handles the execution. Set up a DCA bot around your key retracement levels, define your position sizing rules, connect your broker — and the system runs automatically. No coding, no manual entry. Try Elirox for free.
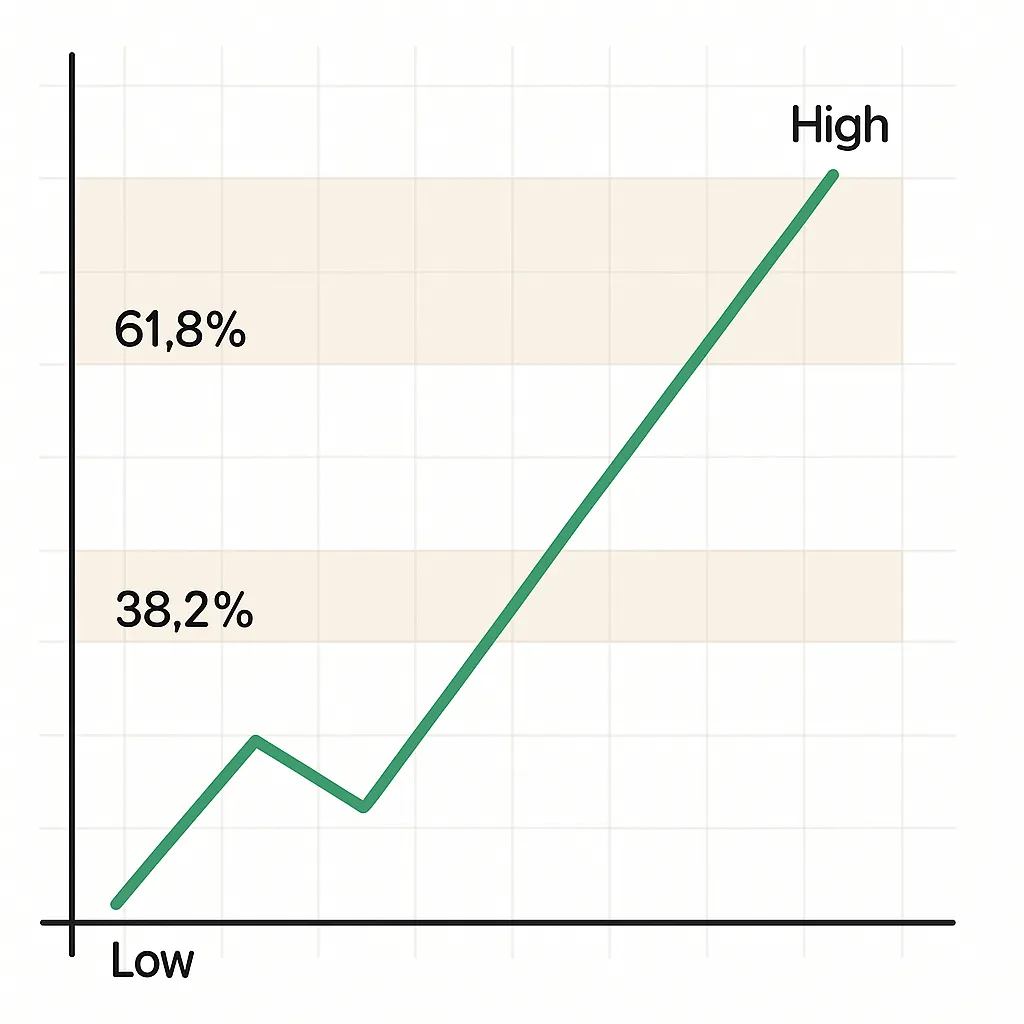
The core retracement levels most traders use are 38.2%, 50%, 61.8%, and 78.6%. Each reflects a different type of pullback behavior, risk/reward profile, and need for confirmation.
| Level | Typical Behavior | Use Case / Notes |
|---|---|---|
| 38.2% | Shallow pullback in strong trends; momentum remains dominant. | Favors aggressive continuation entries; seek strong trend confirmation. |
| 50% | Median correction; common in orderly trends. | Balanced risk/reward; combine with structure and candle confirmations. |
| 61.8% | “Golden ratio” pullback; often attracts deeper dip-buying or rally-selling. | High-quality zone when aligned with confluence and trend context. |
| 78.6% | Deep retracement; trend is vulnerable but not invalidated. | Requires strong confirmation; smaller size or wider stops recommended. |
Depth of pullback often reflects market conditions. Strong, impulsive trends commonly retrace to 38.2%–50%. Slower or corrective environments may reach 61.8%–78.6%. The deeper the pullback, the more you must demand clear validation before entry.
The tool’s accuracy depends on consistent application. These are the core fib rules forex traders should follow:
A disciplined fib pullback entry forex plan revolves around three steps: define the trend and most recent impulse, map retracement levels, and wait for confirmation at a candidate level. The best entries occur when a pullback touches a level that aligns with structure and then prints a clear signal of rejection or continuation. The 61.8 retracement forex entry is popular because it often combines attractive risk/reward with solid mean-reversion dynamics in trends.
Your entry protocol should be consistent:
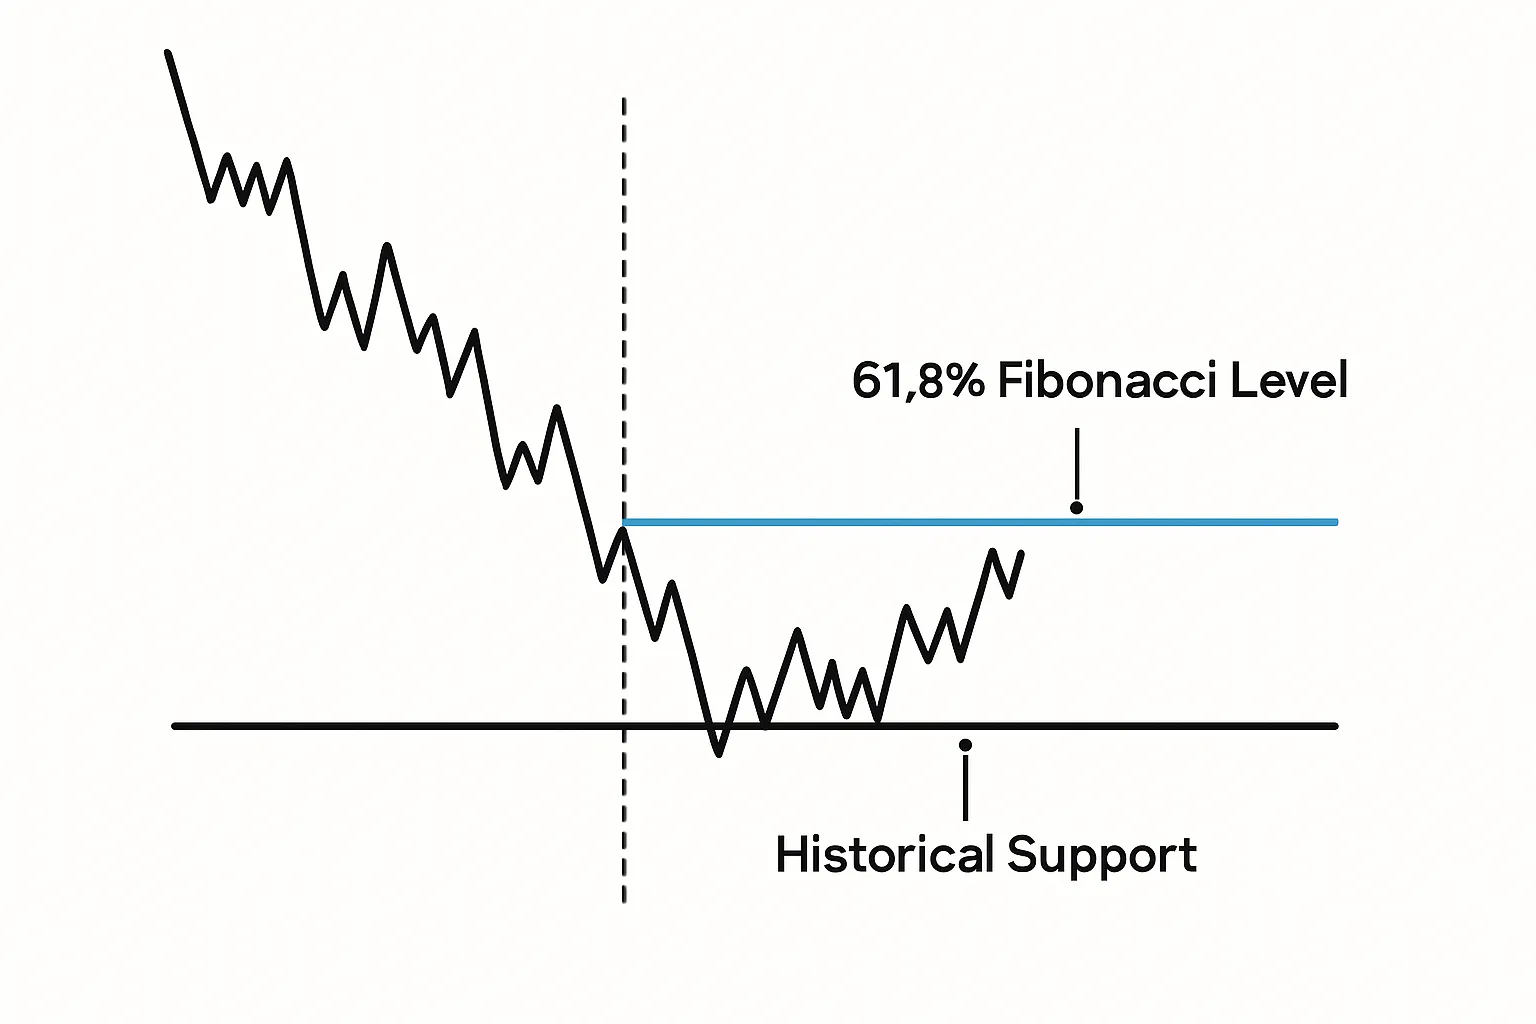
The 61.8% level, derived from the golden ratio, often marks the zone where countertrend participants take profit and trend participants re-enter. It is deep enough to improve reward-to-risk (because stops can be tucked behind the swing or the 78.6%) yet not so deep as to imply a trend failure by default.
Why traders use it in practice:
Execution tips:
Shallow pullbacks (38.2%) occur in strong trends where buyers or sellers step in early. These entries are more aggressive and typically require tighter confirmation and strong momentum context. The 50% level, while not a Fibonacci ratio mathematically, is a widely respected midpoint of many impulses.
Approach guidelines:
Confluence is what elevates Fibonacci from a measuring tool to a tradable strategy. The term fib confluence forex refers to aligning a retracement level with other independent signals—horizontal support/resistance, trendlines, moving averages, or session-based context—to improve the quality of the setup. When multiple independent factors point to the same price area, reactions are often clearer.
Principles for building confluence:
Horizontal levels are the bedrock of market structure. When a Fibonacci retracement aligns with a proven historical level, the area often attracts a sharp reaction because multiple trader groups are focused there. This is the most common and effective form of confluence because it marries a predictive tool with observable market memory. To formalize it, label your key horizontal zones first, then note which Fibonacci levels overlap. This is the essence of fib + support resistance forex: use Fibonacci to refine a pre-existing level, not to create it.
Execution notes:
Trendlines (or channels) provide dynamic structure and context to pullbacks. When a retracement level coincides with a tested trendline, the zone gains credibility from both horizontal ratios and diagonal structure. This fib + trendline forex confluence is especially helpful in steady, orderly trends where price respects the channel boundaries.
Execution notes:
Your targets and stops define the strategy’s edge as much as your entry. The fib extensions targets forex approach uses extension levels—projections beyond 100% of the measured impulse—to set objective take-profit zones. After the pullback completes and price resumes the trend, extensions such as 127.2% and 161.8% offer structured exit points that are consistent across instruments and timeframes.
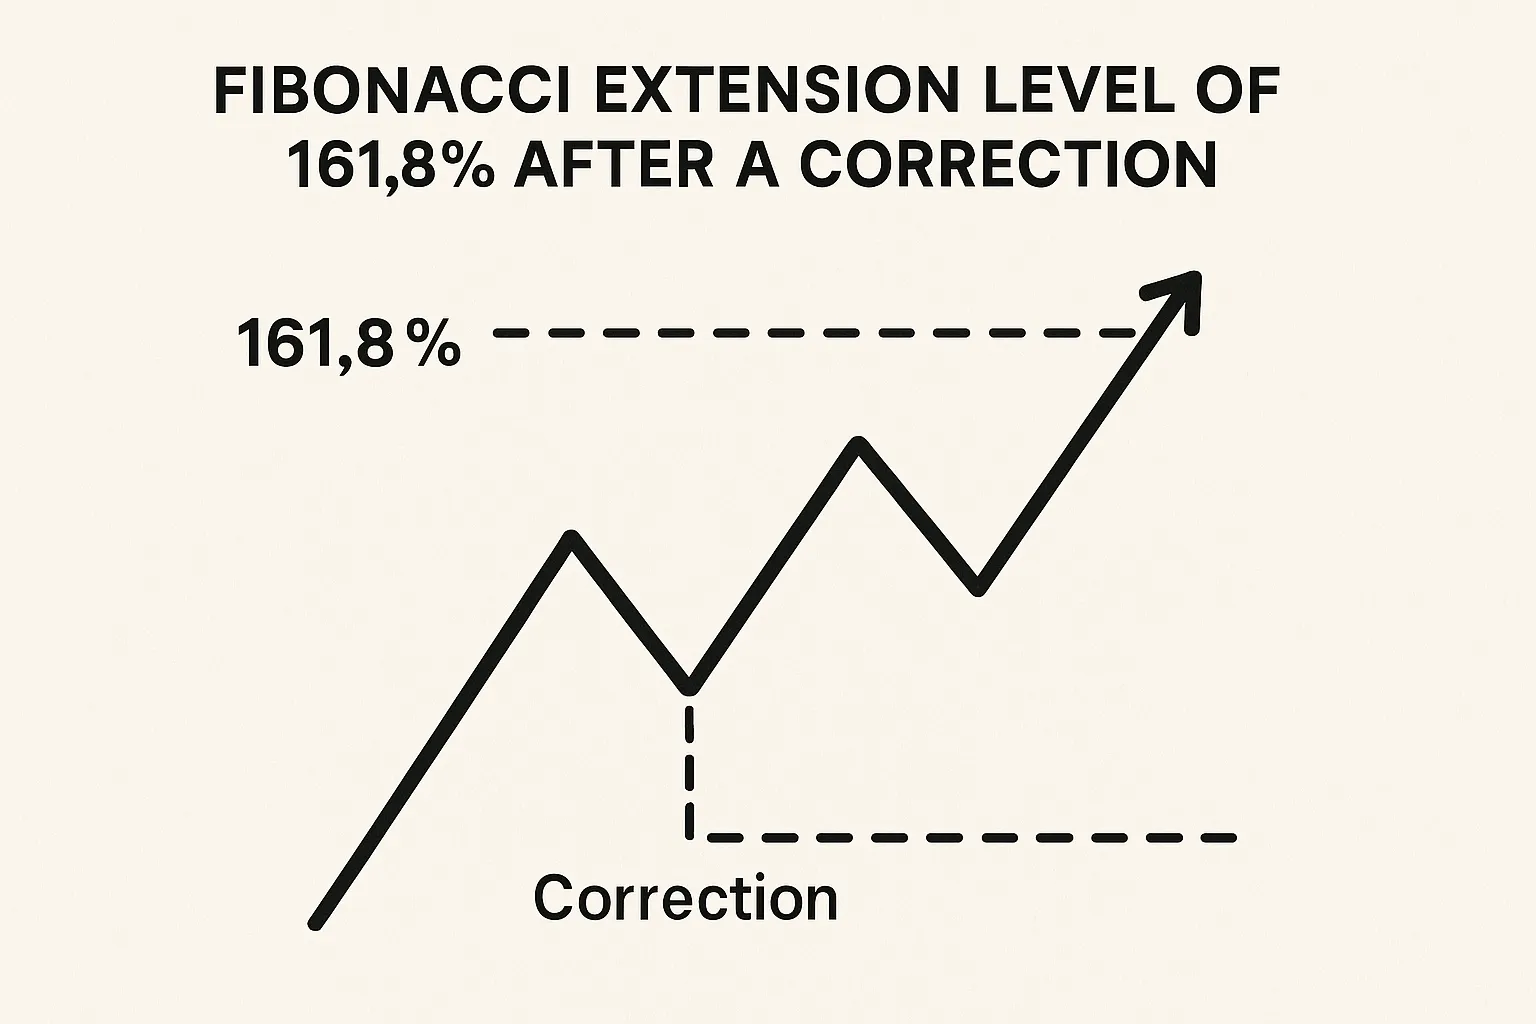
Extension levels translate the magnitude of the prior impulse into forward targets. To project them, use the same swing anchors you used for the retracement:
Target selection:
Trade management:
Stops protect both capital and strategy integrity. Place them where the setup is objectively invalid:
Risk management principles:
Fibonacci adapts well across trading styles, provided you scale expectations to volatility and timeframe. Swing traders often use higher timeframes (H4/D1) to define swings and then refine entries on H1/M30. Intraday traders apply the same logic to smaller structures, recognizing that noise increases and levels can be probed more frequently. Regardless of style, the hierarchy is constant: establish the trend, map structure, add Fibonacci to refine zones, and seek confirmation before execution.
When conditions change—such as during news releases or thin liquidity—retracement reactions can be less reliable. In those cases, either stand aside or require stronger confluence and tighter confirmation before committing capital.
For intraday traders, Fibonacci day trading emphasizes speed, clarity, and discipline. Keep trading hours in mind — session transitions (London open, NY open) often produce the clearest impulses and the most reliable retracement setups. Lower timeframes (H1/M30) can produce multiple impulses and pullbacks within a session, but they also introduce false breaks and whipsaw risk.
Practical guidelines:
Used correctly, the Fibonacci retracement forex strategy offers a consistent framework for planning entries, stops, and targets within trending markets. The tool’s value lies in forecasting potential correction zones and projecting realistic objectives — not in predicting reversals by itself. The most reliable reactions arise from confluence: Fibonacci aligned with horizontal support/resistance, trendlines, and clear price action confirmations. Pair that with rigorous risk management — accepting that any level can fail, using mandatory stop losses, and sizing trades conservatively — and you have a methodical, repeatable process. Test your approach on a demo account before committing real capital — Elirox offers $10,000 in virtual funds. Treat Fibonacci as an auxiliary component inside a larger market-structure plan, and it can meaningfully improve clarity, timing, and consistency across trading styles and timeframes.