RSI Trading Strategy in Forex: Master Divergence, Overbought/Oversold, and Settings

A robust RSI trading strategy forex starts with understanding the Relative Strength Index as a momentum tool, then applying it within the broader context of trend, structure, and risk controls. This guide consolidates the essential RSI concepts—settings, overbought/oversold behavior, centerline logic, divergence, and advanced swing rejection—into a practical framework you can validate through historical chart review and execute with clear, rule-based trade management. Throughout, remember: RSI is a momentum indicator. It should not be used in isolation, particularly in strong trends where “overbought” or “oversold” can persist. Confirmation and risk management are non-negotiable.

What is the Relative Strength Index (RSI)?

The Relative Strength Index (RSI) is a momentum oscillator that measures the speed and magnitude of recent price changes on a bounded scale from 0 to 100. It helps traders gauge when momentum is accelerating or weakening, which can precede pullbacks, reversals, or trend continuations. Unlike a trend indicator, RSI does not tell you the prevailing direction by itself; instead, it shows how forceful the latest price moves have been relative to recent losses or gains.

Traders use RSI to:

  • Identify potential exhaustion in rallies or selloffs (overbought/oversold context).
  • Confirm directional bias with the centerline (50-level) in trending conditions.
  • Spot divergences between price and momentum that may signal a change or continuation.
  • Execute advanced patterns like swing rejection to anticipate a shift in control.

Because RSI is a momentum indicator, it is most effective when combined with trend assessment and key levels. Overbought/Oversold readings alone are unreliable within strong trends.
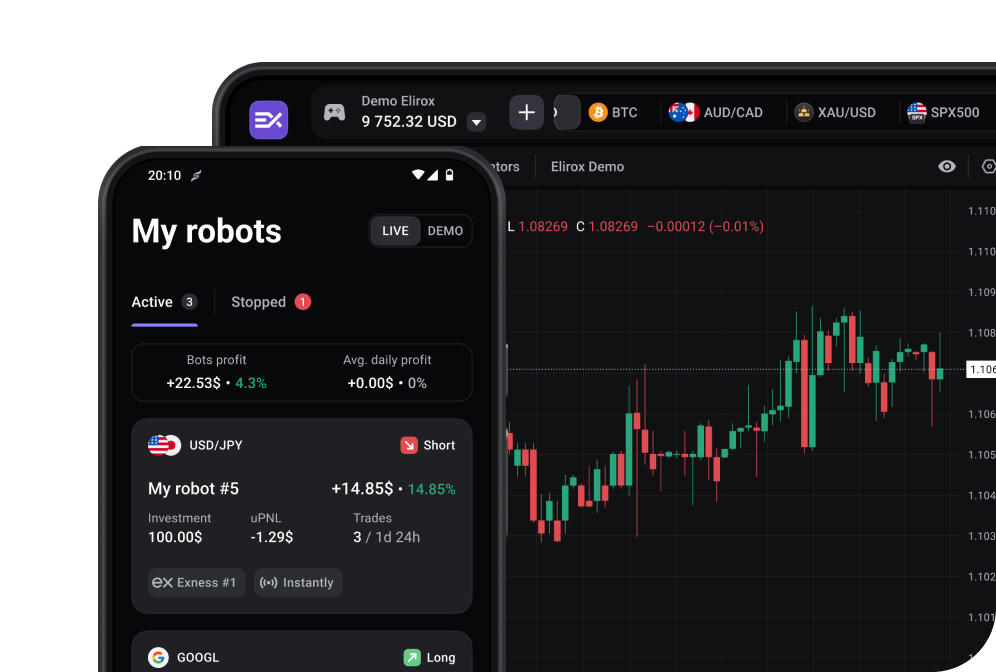
Understanding the RSI Formula

RSI uses average gains and losses over a chosen period (commonly 14) and normalizes them to a 0–100 scale. The core expression is:
RSI = 100 - [100 / (1 + RS)]
where RS is the ratio of average gains to average losses over the lookback.

Key steps:

  • Compute average gain and average loss over the lookback (Wilder’s smoothing is typically used).
  • Calculate RS = Average Gain / Average Loss.
  • Convert RS to RSI using the formula above.
  • Readings above 50 indicate net positive momentum; below 50 indicate net negative momentum.

The formula matters because it keeps RSI bounded, making 30/70 thresholds and the 50 centerline meaningful reference points for momentum behavior.

Standard RSI Settings (RSI 14 Strategy Forex)

The 14-period input—popularized by J. Welles Wilder—balances responsiveness and noise. In the RSI 14 strategy forex, the standard 14 setting is widely used because it captures a representative sample of recent momentum without whipsawing excessively. For most currency pairs and conditions, 14 provides a stable baseline for trend confirmation via the 50 line and for interpreting overbought/oversold zones.

Considerations for RSI settings forex:

  • Shorter periods (e.g., 5–9) increase sensitivity for scalping or very short-term swing captures but can produce more false signals.
  • Longer periods (e.g., 21–28) smooth the oscillator, helping position and swing traders reduce noise and focus on higher-quality signals.
  • Default levels at 70/30 are common, but traders sometimes adjust to 80/20 in strong-trend markets to reduce premature countertrend signals.

Regardless of the period, always prioritize confluence: align RSI insights with trend direction, market structure, and risk management.

Core RSI Strategies for Forex Trading

Overbought and Oversold Signals (The 70/30 Zones)

The classic rsi overbought oversold forex approach uses the 70/30 thresholds to frame potential exhaustion. However, 70 or 30 are not “press buy/sell” signals; they are warnings that momentum is stretched. In a strong uptrend, price can hold above 70 for extended periods, and in a strong downtrend, below 30 for longer than expected. This is why the RSI 30/70 strategy must include confirmation:

Practical rules:

  • In an uptrend, treat dips toward or below 30 as potential pullback opportunities only if price structure remains bullish (higher highs/higher lows) and RSI recovers above 30 with improving swing structure.
  • In a downtrend, treat spikes toward or above 70 as potential pullback opportunities only if price structure remains bearish and RSI rolls back below 70.
  • Time entries with confirmation: for example, a reclaim of RSI 50 in an uptrend, a bullish candle at support, or a break back above a recent minor swing high. The inverse applies in downtrends.

Risk management:

  • Place stops beyond the invalidation point of the setup (e.g., below the swing low for long trades), not merely because RSI left an extreme.
  • Partial profits at logical structure targets (prior swing, session high/low) and trailing stops help neutralize the inevitable false starts.

The Centerline Crossover (The 50 Level)

The RSI 50 level acts as a directional filter. While not a trend indicator by itself, RSI crossing and holding above 50 typically reflects net positive momentum; crossing and holding below 50 reflects net negative momentum. Traders use it to:

  • Confirm trend bias: only take long setups when RSI is above 50 and short setups when RSI is below 50.
  • Validate pullback entries: in an uptrend, RSI dipping toward 40–50 and then turning up suggests momentum re-acceleration.
  • Filter overbought/oversold signals: ignore early countertrend fades until RSI transitions through 50 in the direction you intend to trade.

This centerline logic reduces whipsaws associated with trading extremes blindly, particularly during strong trends—where the “overbought” or “oversold” labels can remain for a long time.

Advanced RSI Trading Techniques

Trading RSI Divergence in Forex (RSI Divergence Forex)

Divergence is the disagreement between price and momentum. If price makes a new extreme but RSI does not confirm, it warns that trend strength may be waning (regular divergence). Hidden divergence, by contrast, often signals continuation after a pullback. Divergence is best traded with confirmation—such as a manual break of minor structure, an RSI centerline crossover, or a clear reversal candle at a key level—because divergence alone can persist for multiple swings, especially in strong trends.

Chart example of Bullish Divergence.
Chart example of Bearish Divergence.

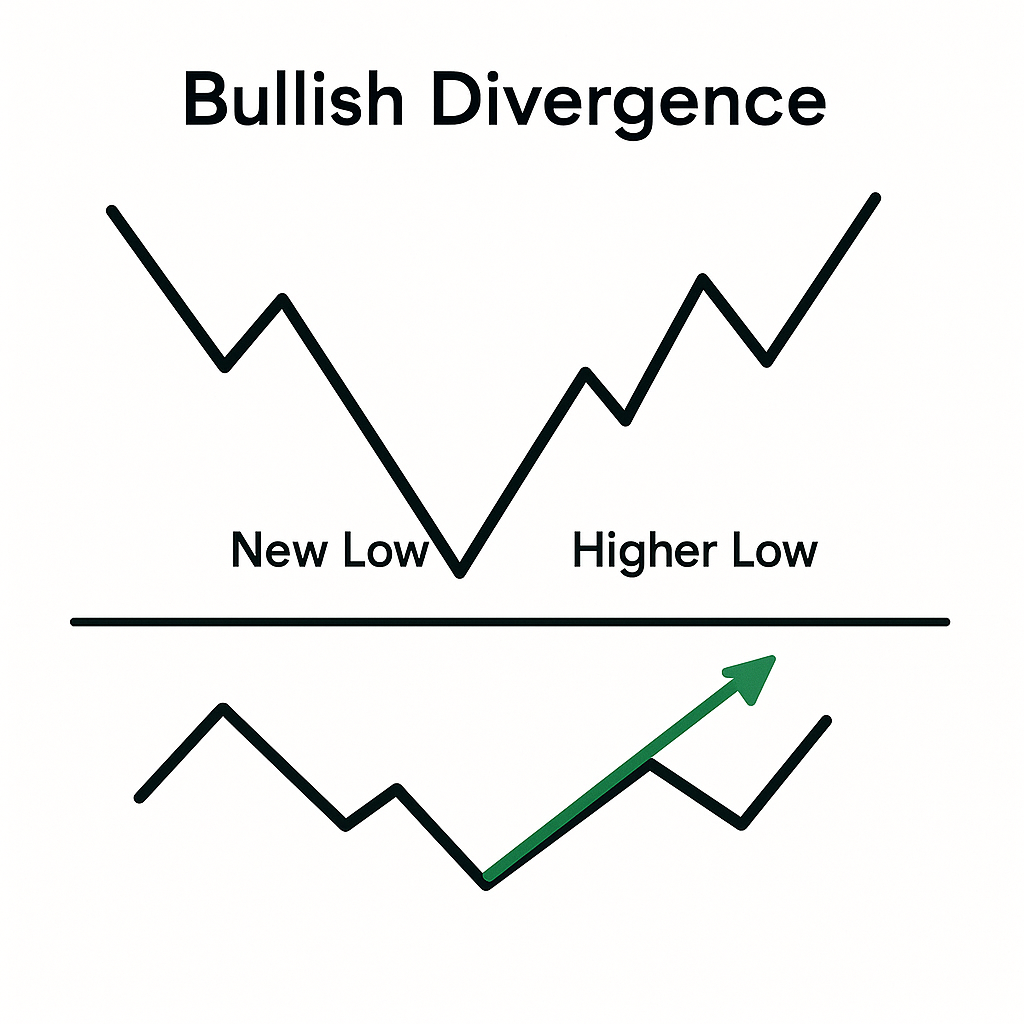
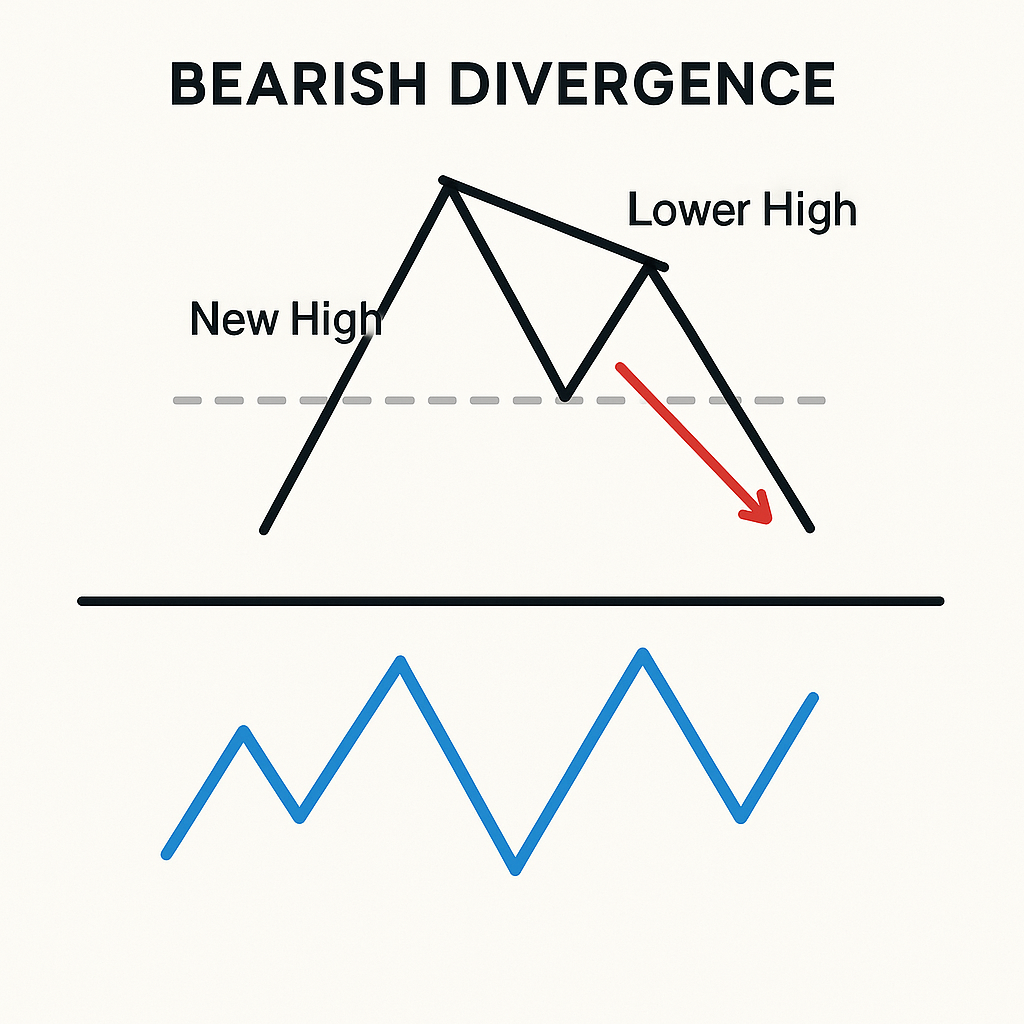
Regular divergence (potential reversal):

  • Bullish regular divergence: Price prints a lower low, but RSI prints a higher low. This suggests selling pressure is weakening. Typical confirmation: break above a minor swing high, RSI reclaiming 50, or a strong bullish candle at support. Entry can be on the break or a retest; stop commonly below the divergence low.
  • Bearish regular divergence: Price prints a higher high, but RSI prints a lower high. This suggests buying pressure is weakening. Confirmation: break below a minor swing low, RSI dropping under 50, or bearish rejection at resistance. Stop commonly above the divergence high.

Hidden divergence (potential trend continuation):

  • Hidden bullish divergence: Price makes a higher low within an uptrend, while RSI makes a lower low. This indicates momentum reset without breaking the uptrend. Entry: on RSI turning up and/or reclaiming 50 with a bullish structure cue; stop below the higher low.
  • Hidden bearish divergence: Price makes a lower high within a downtrend, while RSI makes a higher high. This indicates a momentum reset within the downtrend. Entry: on RSI turning down and/or losing 50 with a bearish structure cue; stop above the lower high.

Execution guidelines:

  • Confluence: Combine divergence with key support/resistance, trendlines, or session levels. Divergence at arbitrary locations is lower probability.
  • Confirmation: Favor entries only after a triggering event—centerline crossover, break of minor structure, or a strong candle reacting at a known level.
  • Risk controls: Divergence fails. Keep risk per trade controlled, scale out at logical targets, and avoid countertrend divergence during very strong one-way markets unless confirmation is robust.

RSI Swing Rejection Strategy (RSI Swing Rejection Forex)

Swing rejection isolates momentum failure at an extreme and often anticipates a pivot. A common bullish variant:

  1. RSI drops below 30 (oversold),
  2. RSI bounces back above 30,
  3. RSI pulls back but fails to return below the prior oversold extreme (a “higher low” on RSI),
  4. RSI turns up and breaks the prior RSI swing high.

This sequence reflects sellers losing control before price fully reveals it. The bearish version mirrors the steps at 70:

  1. RSI moves above 70,
  2. RSI slips back below 70,
  3. RSI rebounds but fails to make a higher RSI high (a “lower high” on RSI),
  4. RSI turns down and breaks the prior RSI swing low.

Tactics:

  • Trade in context: With trend alignment, swing rejection can time pullback entries; countertrend, it can signal a potential reversal but demands stronger confirmation (e.g., reclaim/loss of the 50 line, structural break).
  • Stops and targets: Set stops beyond the price swing that coincides with the RSI failure. Target the opposite side of the range or the next structural level; consider partial profits and trailing management.

Combining RSI with Other Indicators

RSI gains strength when used for momentum confirmation alongside trend or structure tools. The aim is alignment: trade directionally when multiple tools say the same thing, and de-emphasize pure threshold readings in isolation.

RSI and MACD Combination for Confirmation

The RSI + MACD strategy forex blends momentum (RSI) with trend and momentum histogram dynamics (MACD). A practical framework:

  • Trend and bias: Use MACD line relative to signal line and zero line to define bias. Above zero with a recent bullish crossover favors longs; below zero with a recent bearish crossover favors shorts.
  • RSI filter: Only long when RSI is above 50 and buy pullbacks where RSI resets toward 40–50 then turns up; only short when RSI is below 50 and sell rallies where RSI resets toward 50–60 then turns down.
  • Entry trigger: Combine visible MACD momentum expansion (histogram growing in the trade direction) with RSI turning in alignment and a clear price action cue at a level (manual break/retest or rejection wick).
  • Exit and risk: Predefine invalidation (recent swing), scale out near opposing structure, and tighten stops as MACD momentum wanes or RSI flattens near 50.

This combination helps avoid the common pitfall of shorting “overbought” RSI during a strong MACD-uptrend or buying “oversold” RSI in a MACD-downtrend.

RSI and Trendlines/Support and Resistance

RSI is well-suited to validating structure:

  • At resistance, a lower RSI high or bearish regular divergence can confirm a fade or trend resumption lower.
  • At support, a higher RSI low or hidden bullish divergence can confirm continuation.
  • On breakouts, RSI holding above 50 (for upside) or below 50 (for downside) adds confidence that momentum supports the move.

Rules of thumb:

  • Always anchor decisions in price structure and levels first; use RSI to confirm momentum alignment.
  • Be cautious trading RSI extremes into major levels without a clear price reaction.
  • If a breakout occurs with RSI failing to cross or hold above 50 (upside) or below 50 (downside), consider the breakout suspect.

Adapting RSI to Different Timeframes

Timeframe changes alter volatility and signal density. Short timeframes require tighter controls and often shorter RSI periods; longer timeframes benefit from standard or longer periods, with more time to confirm signals and manage trades. Regardless of timeframe, risk per trade and overall risk exposure must stay consistent with a tested plan.

RSI for Scalping and Day Trading (Shorter Timeframes)

Scalpers and intraday traders often prefer higher sensitivity, using RSI settings around 5–9 and emphasizing the 50-level filter with session levels. In RSI scalping forex, the goal is to align quick momentum turns with micro-structure (e.g., minor swing breaks) while avoiding countertrend fades in strong moves. Consider anchoring bias with a higher timeframe (e.g., M15/H1), then executing on M1–M5 with a faster RSI.

RSI Period Timeframe Focus Pros Cons
5 M1–M5 Very responsive; early momentum cues High noise; more false signals; requires strict filters
7 M1–M15 Balanced sensitivity for scalping/day trades Still choppy in fast markets; needs confluence
9 M5–M15 Smoother than 7; fewer whipsaws Slightly later signals; can miss rapid flips
14 M5–H1 Stable baseline; reliable 50-level reads Slower for pure scalps; fewer setups

Execution tips:

  • Use 50-level alignment with the prevailing intraday bias; avoid fighting strong one-way sessions.
  • Confirm with structure: break/retest patterns or rejection at session VWAP/previous day high-low (if used) and major FX session opens.
  • Keep stops tight and take partials quickly; intraday reversals happen fast.

RSI for Swing Trading (Longer Timeframes)

For swing trading on H4/D1, the standard RSI 14 is typically preferred. It filters noise and allows clearer interpretation of 70/30 conditions and the 50 centerline. Practical applications:

  • Trend confirmation: Trade in the direction of the weekly/daily bias when RSI respects the 50 line on pullbacks.
  • Divergence at levels: Regular divergence at multi-week support/resistance can precede meaningful swings; hidden divergence helps time continuation entries after pullbacks.
  • Patience and risk: Use wider stops aligned with daily structure and plan to scale out at major levels. Backtest rules for markets with extended trends where “overbought/oversold” is unreliable without confirmation.

Setting Up and Using RSI on Trading Platforms (RSI MT4 / RSI MT5)

RSI is built-in on both MetaTrader platforms. Basic setup steps are similar for RSI mt4 and RSI mt5:

  • Add the indicator: Insert > Indicators > Oscillators > Relative Strength Index.
  • Set the period: Start with 14 for the standard baseline; adjust to 5–9 for scalping or 21+ for smoothing.
  • Configure levels: Add 30, 50, and 70. Some traders include 40 and 60 as trend filters—optional and subject to backtesting.
  • Styling: Choose line color and thickness for clarity; ensure RSI pane is visible below price.
  • Templates: Save chart templates with your RSI settings and levels for consistency across pairs and timeframes.
  • Validation: After applying, scroll back to visually validate that RSI behaves as expected on your pair/timeframe. Note how the 50 line aligns with trends and how 70/30 signals behave in strong moves.

Operational practices:

  • Do not treat RSI signals in isolation; use market structure and trend context.
  • During news or thin liquidity, expect more noise in the oscillator; stand aside or require stronger confirmation.
  • Keep risk management rules consistent regardless of platform features.

Conclusion: Maximizing Profit with the RSI Strategy

A disciplined RSI trading strategy forex integrates RSI’s momentum insights—70/30 zones, 50-level confirmation, divergence, and swing rejection—within a robust framework of trend, structure, and risk controls. Use the RSI 14 strategy forex as a stable baseline, then adapt RSI settings forex to your timeframe and execution style. In strong trends, remember that overbought/oversold can persist; prioritize confirmation, and rely more on divergence and centerline behavior than on blind fades.

No indicator guarantees certainty.Validate your rules through historical chart review across pairs and regimes, then forward-test with reduced size or on a demo environment, enforcing risk management on every trade. By combining RSI with complementary tools such as MACD, trendlines, and support/resistance—while honoring the momentum nature of the indicator—you can build a consistent process that captures momentum shifts without overreacting to every extreme.

Ready to Automate Your Forex Trading?
Launch your AI-powered automated forex strategy in minutes with a simple, seamless broker connection.
The website elirox.com and Mobile application are owned and operated by ELIROX LLC. The company Elirox LLC is registered under registration Number: 3582, with the registered company address at Suite 305, Griffith Corporate Centre, Beachmont, Kingstown, Saint Vincent and the Grenadines. The commercial name of the company is “Elirox”. The services offered by this Website and Mobile application can be executed only by fully competent adults.
© Elirox, 2025
Download the Elirox app
Become a partner