What is Price Action Trading? (Naked Chart Trading Forex)
Price action trading is the practice of making trade decisions directly from price—swings, highs/lows, and candle formations—using market structure to judge when buyers or sellers are in control.
In practical terms, the market leaves a visible footprint: impulsive moves and corrective pullbacks, rejections at key levels, and consolidations before continuation or reversal. Traders observe these elements on a “clean” or “naked” chart to gauge probability. While many practitioners keep charts free of indicators, some overlay a simple set of moving averages (EMA 20/50) to visualize dynamic support/resistance and trend context; the decision framework still comes from price itself.
Key principles:
- Context first: A single candle is rarely meaningful in isolation. The same pattern at a major level can be high-quality but low-quality at mid-range.
- Level-driven: Horizontal support/resistance, swing structure, and trend lines guide expectations.
- Timeframe clarity: Ideal signals generally form on higher timeframes (H4 and Daily), where noise is lower and levels are more respected.
- Risk discipline: Entries must include a predefined stop loss and position sizing that fits the account risk.
💡 Reading setups takes skill. Execution doesn’t have to be manual.
Once you’ve identified your levels and pattern, Elirox handles the mechanical side — automated entries, position sizing, and constant monitoring without you watching every tick. Connect your broker, build your rules into a bot, and run it — no VPS required. Try Elirox for free.
Price Action vs. Indicators (Price Action vs Indicators Forex)
When comparing price action vs indicators forex, understand that both are tools, but they process the same market information differently. Price action interprets current and recent prints, while indicators summarize historical data into formulas that lag turns by design.
| Dimension | Price Action (Direct) | Indicators (Lagging) |
|---|
| Primary Input | Raw price: swings, highs/lows, candles, levels | Calculated values from past price (e.g., moving averages, oscillators) |
| Signal Timing | Reactive to current bar/structure; can flag shifts early at key levels | Confirms after movement has begun; tends to enter later |
| Market Context | Built-in: reads trend, level confluence, momentum directly | Often relies on indicators or settings to approximate context |
| Adaptability | Flexible across conditions with pattern/structure judgment | Settings-dependent; may need frequent tuning |
| Clarity on HTFs | Strong on H4/D1; less noise, clear levels and patterns | May still lag on HTFs; smoothing can hide early shifts |
| False Signals | Reduced with strict level/context filters | Whipsaws common in ranges or around news |
| Best Use-Case | Reading turns at support/resistance; breakout/continuation logic | Measuring trend strength, momentum, and mean reversion |
| Risk Alignment | Natural stops from pattern extremes and structure | Stops often derived indirectly from indicator levels |
Takeaway: Let price and structure drive the plan. Indicators can support the read, but they shouldn’t replace clear levels, context, and risk rules.
Core Components of Price Action Analysis
Price action analysis rests on three pillars: the story in each candle, the path of swings and momentum, and the map of key levels where decisions cluster. Together, they establish the context you need before acting on any pattern.
Reading Candlestick Patterns (Candlestick Patterns Forex Strategy)
Candles compress a battle between buyers and sellers into an open, high, low, and close. Read them as a narrative:
- Body size: A large, full-bodied candle closing near its high or low (marubozu-like) implies decisive control by one side. Small bodies indicate indecision or stalling.
- Wicks (tails): Long upper wicks show rejection of higher prices; long lower wicks show rejection of lower prices. The longer and more abrupt the rejection at a level, the more meaningful the information.
- Closes relative to range: A strong close beyond a key level suggests acceptance; repeated failures to close beyond it suggest rejection.
- Clustering: One strong candle is useful, but sequences matter. For instance, a long rejection wick, followed by a strong close in the opposite direction, strengthens the turn narrative.
In practice, treat candles as snapshots within a broader structure. A textbook-looking candle is not sufficient; it must align with the higher timeframe bias and sit at a meaningful level to carry weight.
Identifying Key Levels (Support Resistance Price Action)
Support and resistance are decision zones where order flow changes hands. Technical quality improves when patterns align with these levels.
How to define key zones:
- Horizontal levels: Prior swing highs/lows that caused significant moves. The more tests and stronger reactions, the more important the level.
- Higher timeframe origins: Weekly and Daily levels should anchor your bias; H4 refines entries. Levels from higher timeframes dominate lower ones.
- Trend lines and channels: Diagonal structure offers dynamic reaction points, but confirm with horizontal levels for stronger confluence.
- Dynamic levels: Some traders use EMA 20/50 as a simple trend overlay, treating them as areas for pullback continuation rather than precise lines.
Application rules:
- Read patterns in context. A strong signal at a strong level has meaning; isolated patterns in the middle of a range are unreliable.
- Mark levels ahead of time. Let price come to you rather than chasing.
- Favor H4/D1 setups for clarity. Lower timeframes introduce noise that can disguise true intent.
High-Probability Price Action Setups
Three setups consistently appear across FX pairs and timeframes: the Pin Bar, the Inside Bar breakout, and the Fakey (false-break) setup. Each reflects a distinct order-flow event: rejection, consolidation, and trap. Their reliability rises when they form at key levels or with higher timeframe trend alignment, especially on H4 and Daily charts.
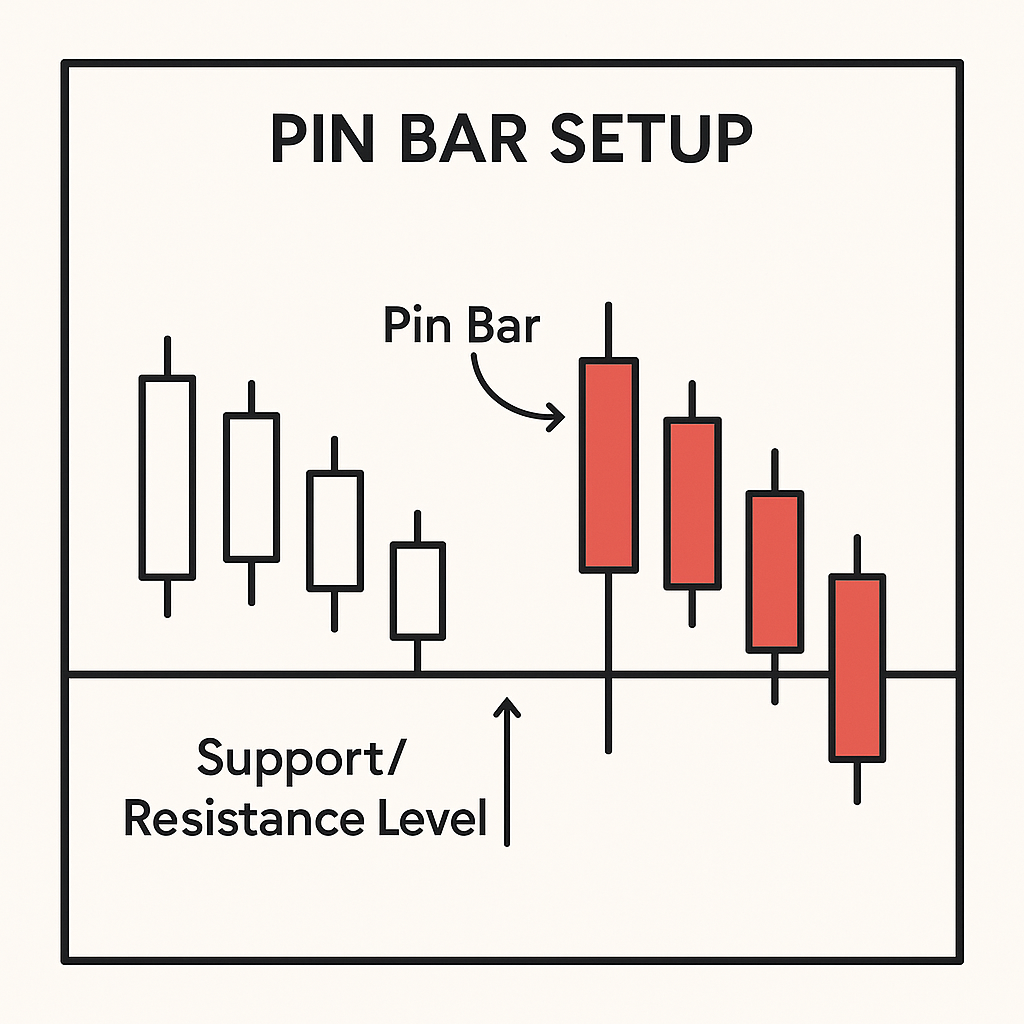
The Pin Bar Strategy (Pin Bar Strategy Forex)
A Pin Bar is a one-candle rejection pattern characterized by a long tail (wick) and a small real body near one end of the range. The tail shows a sharp probe into a level and an immediate rejection; the small body confirms the failure to sustain that move. Bullish Pin Bars have long lower tails at support; bearish Pin Bars have long upper tails at resistance. The ideal form has:
- Tail comprising at least two-thirds of the candle’s total range
- Small body closing within the prior range, near the opposite end from the tail
- Location at a meaningful level (horizontal S/R, prior swing, or EMA 20/50 in trend)
Context and filters:
- Level confluence: Prior swing high/low, HTF level, or dynamic mean (EMA 20/50).
- Trend alignment: With-trend Pin Bars at pullback levels are higher probability than pure countertrend reversals.
- Higher timeframe clarity: Prefer H4/D1 prints; avoid clusters of conflicting candles.
Entry and risk management:
- Entry: Commonly on a break of the Pin Bar’s nose (the end opposite the tail). A conservative alternative is a limit entry on a partial retrace into the Pin Bar’s range if structure permits.
- Stop loss: Set behind the tail (the opposite end of the pattern). This directly aligns risk with the invalidation point.
- Targets: Use nearby structure—first target at the most recent swing or mean; subsequent targets at the next HTF level. Trail stops behind swing highs/lows if seeking extended moves.
- Trade management: If the break triggers but price stalls before clearing the nearest obstacle, consider partial profits or tightening risk to reduce exposure.
Quality checklist:
- Pronounced tail rejection from a clean level
- Small body with decisive close direction
- No immediate obstacles within 1R
- H4/D1 print preferred
Trading the Inside Bar Breakout (Inside Bar Breakout Forex)
An Inside Bar is a two-candle consolidation where the second candle’s range is fully contained within the prior “mother bar.” It reflects compression of volatility and temporary equilibrium before a directional expansion. The strategy seeks to participate in the breakout that resolves this compression, ideally in the direction of the prevailing trend and from a relevant level.

Context and filters:
- Trend and level: With-trend Inside Bars forming at pullback support/resistance, or just above/below a key HTF level, carry better odds than random mid-range consolidations.
- Mother bar character: A strong mother bar that aligns with the intended direction can add weight.
- Surrounding space: Ensure room for price to expand at least 1–2R before the next obstacle.
Entry and risk management:
- Entry: Place stop orders beyond the mother bar’s high (for longs) or low (for shorts). Some traders require the break to also clear the Inside Bar’s range to reduce false starts.
- Stop loss: Set beyond the opposite end of the mother bar or, more tightly, beyond the Inside Bar’s far wick. The safer option is the mother bar extreme.
- Targets: Map structure targets ahead of time: first target near the next swing or measured range of the mother bar; further targets at HTF levels.
- Invalidations: If price breaks one side, fails, and re-enters the range, reduce exposure or exit—this often precedes a trap.
Execution notes:
- Higher timeframes (H4/D1) produce cleaner breakouts with fewer whipsaws.
- Be cautious trading Inside Bar breakouts directly into immediate resistance/support; the breakout can suffocate quickly.
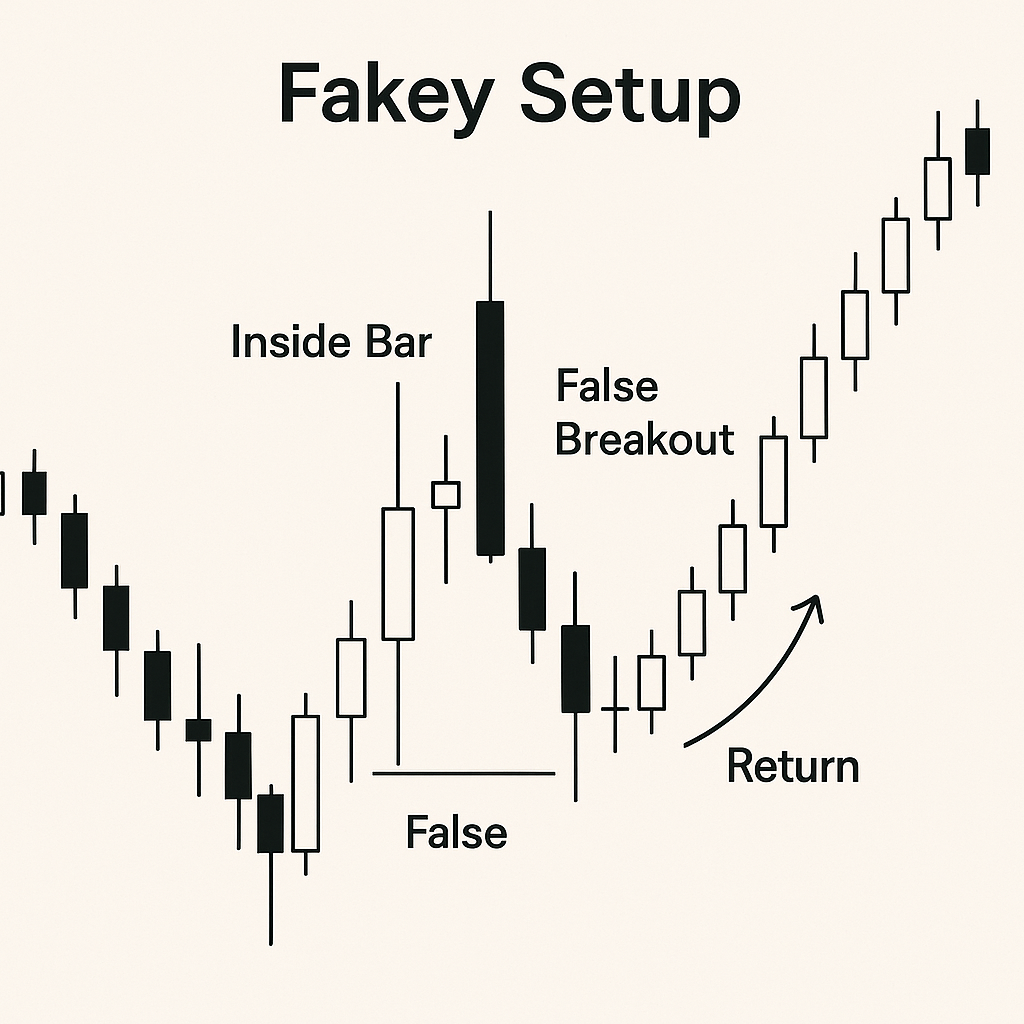
Understanding the Fakey Setup (Fakey Setup Forex)
A Fakey is an advanced false-break pattern built on the Inside Bar structure. It occurs when price first breaks out of the Inside Bar range (often beyond the mother bar extremity), entices breakout traders, and then swiftly reverses to re-enter the range and break out in the opposite direction. This creates a trap that reveals aggressive absorption by the other side—valuable information when it happens at a strong level.
Context and filters:
- Location: High-quality Fakeys form at HTF levels—major support/resistance or near EMA 20/50 within a trend. The false break should poke into a known supply/demand pocket.
- Volatility signature: The false-break leg is often fast and emotional; the reversal leg should be decisive, closing back inside the range.
- Space: The “true” direction after the trap should have room to run 1–2R before the next barrier.
Entry and risk management:
- Entry: Conservative entries trigger when price breaks the Inside Bar range in the opposite direction from the false break, ideally surpassing the mother bar midpoint or opposite extreme.
- Stop loss: Place the stop beyond the false-break wick (the trap side). This sits behind the opposite end of the pattern and aligns risk with invalidation.
- Targets: First target near the opposite side of the mother bar, then the next HTF level. Trailing behind swing structure can capture extended reversals.
- Management: If re-entry into the range lacks momentum, consider reducing size. A failed trap can morph into a range.
Professional tips:
- Wait for the close: Reacting before the bar closes risks misreading an in-progress spike.
- HTF bias: A Fakey against the dominant HTF trend requires exceptional level confluence to justify.
Applying Price Action to Different Trading Styles
The price action framework is adaptable across trading horizons. The core logic—context, levels, patterns, and disciplined risk—remains constant, but execution parameters like timeframes, trade duration, and target sizing will differ.
Price Action for Scalping
Price action scalping applies the same logic on 1M/5M charts, with an emphasis on session timing and rapid execution. Trading hours vary by broker — the London open and London/NY overlap typically offer the highest liquidity and cleanest price action setups. Because noise is higher, rules must be stricter and risk tighter.
Key adaptations:
- Session filters: Focus on liquid hours (London open, early New York) when volatility supports clean pushes from levels.
- Structure first: Anchor trades to intraday levels (prior session highs/lows, open levels, and clearly defined micro ranges). Even at 1M/5M, the pattern only matters at a level.
- Pattern selection: Favor simple, fast patterns—mini Pin Bars rejecting a session level, small Inside Bar breaks in trend, or quick two-candle breaks-and-holds.
- Dynamic mean: EMA 20/50 can help define intraday trend and pullback zones. Treat them as dynamic areas, not precise lines.
- Risk and targets: Stop loss belongs behind the opposite end of the pattern (e.g., beyond the Pin Bar tail). Aim for 1–2R, scaling out quickly when price stalls at the next micro structure.
- Trade frequency: Quality over quantity. A few high-quality sequences beat constant engagement.
Execution checklist:
- Is the trade aligned with session momentum?
- Is there clean space to the first target?
- Does the setup occur at or just after a test of a defined level?
- Is the stop placement precise and minimal without being arbitrary?
Price Action for Swing Trading
Price action swing trading is often the highest-clarity application. On H4/D1 charts, levels are well-defined, signals are cleaner, and noise is reduced.
Approach:
- Top-down bias: Start from Weekly to map major levels, refine on Daily, and time entries on H4. Only trade in the direction that the higher timeframe structure supports unless a strong reversal forms at a key level.
- Patience for location: Wait for price to tag HTF support/resistance, prior weekly swing zones, or trend pullback areas around EMA 20/50.
- Signal quality: Prioritize clean Pin Bars and Inside Bar breakouts that present 2R+ potential before the next obstacle. Fakey setups that spring from crowded public breakout zones can catch major reversals.
- Risk management: Stops belong behind the pattern extreme (e.g., beyond the Pin Bar tail or the mother bar high/low). Use position sizing to keep account risk within limits while accommodating wider HTF stops.
- Holding and scaling: Partial profits at the first target lock in risk reduction; leave a runner toward the next HTF level. Trailing behind swing structure allows participation in trend legs.
Outcome expectations:
- Fewer trades than intraday approaches, but typically higher average trade quality.
- Clearer read on momentum and acceptance/rejection at key levels.
- Reduced need for constant screen time, which supports disciplined decision-making.
Conclusion: The Mastery of Price Action
Mastering a price action forex strategy is about reading context first, then acting on high-quality signals that align with structure. New to Elirox? Start with a demo account— $10,000 in virtual funds to apply these setups risk-free, or read how to start trading with Elirox for a step-by-step setup guide. Pin Bars reveal rejection, Inside Bars show compression before expansion, and Fakey setups expose traps — each is reliable only when it forms at meaningful levels and preferably on H4 or Daily charts. Trade on a disciplined, “naked” chart framework, use EMA 20/50 as optional dynamic context, and always place the stop loss behind the opposite end of the pattern (for a Pin Bar, behind the tail). With consistent risk management and a focus on support/resistance, price action provides a direct read on market behavior and a durable foundation for long-term trading development.
Price action is also central to Smart Money Concepts — see the SMC Forex Strategy guide.
Disclaimer: This article is for educational purposes only and does not constitute financial advice.