By the Elirox Team · Updated April 2026
MACD Trading Strategy — Elirox Guide
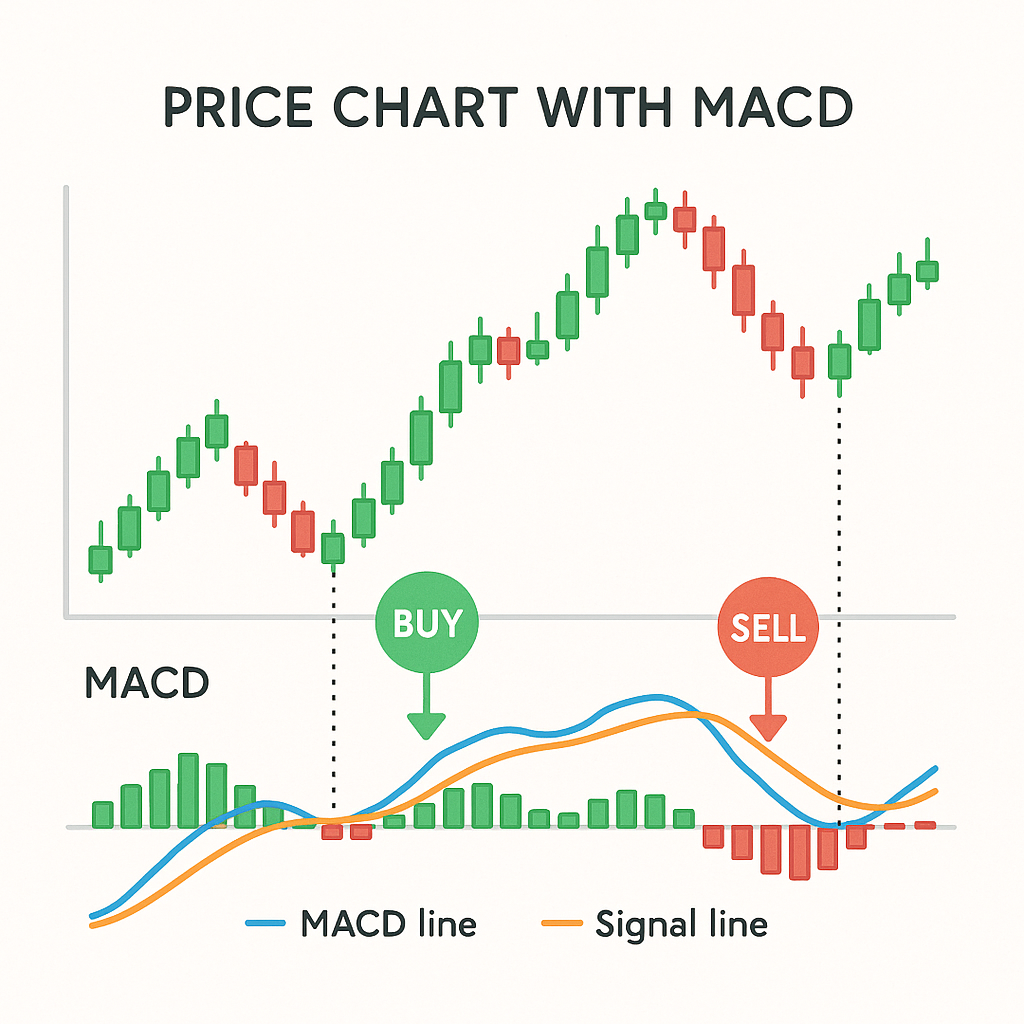
The Moving Average Convergence Divergence (MACD) is a trend-following momentum indicator calculated as the difference between two Exponential Moving Averages (EMAs). In its standard form, MACD = EMA(12) − EMA(26). A 9-period EMA of the MACD line, called the Signal Line, is plotted on top to help identify changes in momentum. The Histogram visualizes the distance between the MACD Line and the Signal Line, expanding when momentum increases and contracting when it slows. A horizontal Zero Line marks the point where the short-term and long-term EMAs are equal.
What is the MACD Indicator?
MACD is a lagging indicator: it reacts to price after movements occur because EMAs and signal smoothing require past data. As a result, signals often arrive late, and in ranging markets MACD can generate a high number of false signals. The indicator works best when markets are trending, and it performs best with strict risk management and clearly defined stop-loss and position sizing rules.
New to Elirox? Learn how the platform works before applying these strategies: What is Elirox and how does it work.

Standard MACD Settings Explained (MACD Settings Forex)
The default MACD parameters are 12, 26, 9:
- 12: the fast EMA period (captures short-term price changes)
- 26: the slow EMA period (captures longer-term trend)
- 9: the Signal Line EMA period applied to the MACD line
These values balance responsiveness and noise. Traders may adapt macd settings forex to different timeframes and instruments—for example, slightly faster settings for intraday charts or slightly slower for higher timeframes—but any change increases the risk of overfitting. Adjustments should be forward-tested, applied consistently, and always accompanied by robust risk controls.
Three Primary MACD Signals for Forex Trading
Traders commonly use three MACD signal types: crossovers of the MACD Line and Signal Line, the crossing of the Zero Line, and divergence between price and the indicator. Each reflects trend and momentum in a different way. Because MACD is lagging, treat these as confirmations rather than standalone trade triggers, and anchor them to price structure and higher-timeframe context.
| Signal Type | Signal Meaning |
|---|
| Crossover | Trend |
| Zero Line | Momentum |
| Divergence | Reversal |
Signal Line Crossover Strategy (MACD Crossover Strategy Forex)
The core signal is the crossover between the MACD Line and the Signal Line. A bullish crossover occurs when the MACD Line rises above the Signal Line, indicating improving upward momentum; a bearish crossover occurs when the MACD Line drops below the Signal Line, suggesting building downward momentum. Because this is a lagging signal derived from smoothed averages, entries will tend to be slightly late and vulnerable to whipsaws in sideways conditions. Use market structure context (trendlines, key levels, or higher-timeframe bias) and pre-defined risk parameters for execution.
Practical execution framework:
- Trend filter: Trade bullish crossovers only when price is trending higher or after a breakout, and bearish crossovers only when price is trending lower or after a breakdown.
- Entry timing: Enter on candle close to avoid intra-candle flips. Alternatively, wait for a small pullback into minor support/resistance to improve reward-to-risk.
- Stop-loss: Place stops beyond a logical invalidation (e.g., below the recent swing low on longs, above the recent swing high on shorts) or use a modest buffer beyond structure.
- Exit plans: Consider partial profits at 1R–2R, trail behind swing structure, and exit on an opposite crossover when momentum clearly fades.
- Risk management: Size positions so that a single loss is within your risk-per-trade cap. Avoid compounding signals in choppy markets.
Common pitfalls:
- Trading every crossover in a range invites whipsaws. Add context and confirmation before acting.
- Over-optimization of parameters can improve backtests but fail in live markets. Keep rules simple and robust.
Zero Line Crossover (Zero Line Crossover MACD)
The Zero Line marks where the fast and slow EMAs are equal. When the MACD Line crosses above zero, it suggests that short-term momentum has turned positive relative to the longer-term average; crossing below zero suggests negative momentum. Zero-line crossovers tend to be slower than signal-line crossovers but can be cleaner for defining trend bias and avoiding countertrend trades.
How to apply:
- Bias filter: Only take long setups when MACD is above zero and short setups when below zero. This reduces countertrend exposure.
- Confirmation: Combine a zero-line cross with price breaking a key level or holding a trendline to validate momentum alignment.
- Exits: If you entered earlier on a signal-line crossover, a subsequent zero-line cross can be used as confirmation to hold. Conversely, a loss of the zero-line may serve as an exit signal if the thesis was trend continuation.
- Risk: Do not treat zero-line crosses as standalone entries; they confirm momentum, not price pattern quality. Maintain predefined stop-losses and position sizing.
Trading MACD Divergence (MACD Divergence Forex)
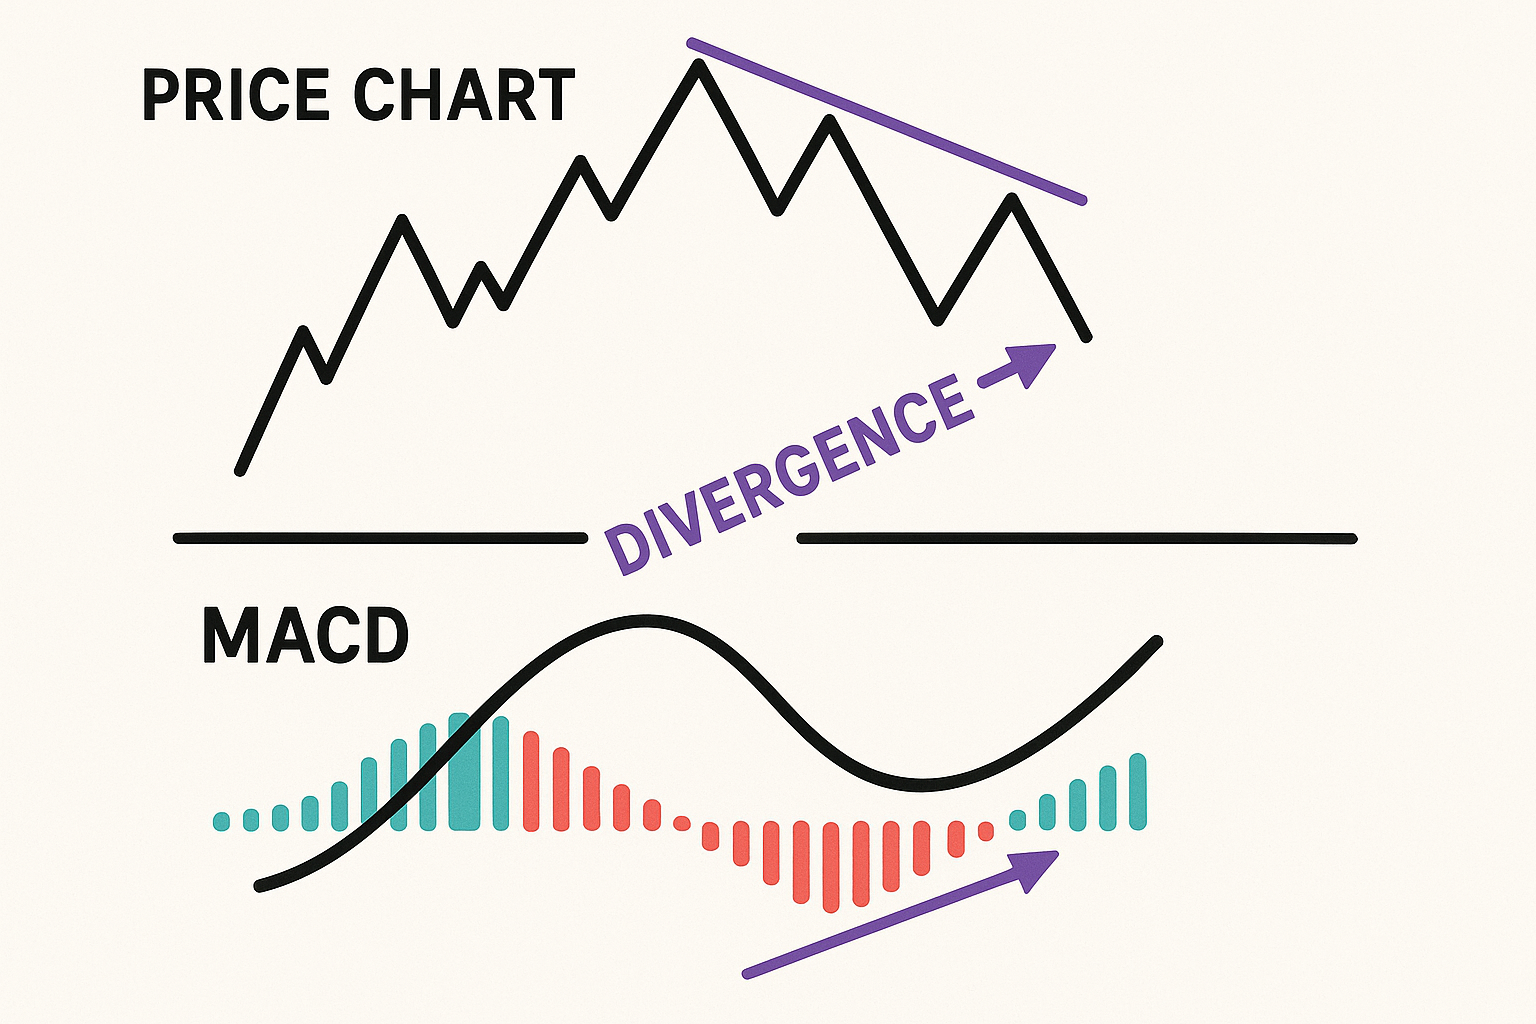
Divergence occurs when price makes a new high/low but the MACD fails to confirm, signaling a potential weakening of momentum and a possible reversal or deeper pullback. Because divergence can persist for several swings, it is not a timing tool by itself. Treat divergence as an early warning and require price confirmation.
Two primary forms:
- Bullish divergence: Price prints lower lows while MACD forms higher lows. This suggests downside momentum is fading. Confirmation could be a break back above a recent swing high, a bullish candle pattern at support, or a MACD signal-line crossover aligned with structure.
- Bearish divergence: Price prints higher highs while MACD forms lower highs. This suggests upside momentum is waning. Confirmation may be a breakdown through support, a bearish reversal pattern at resistance, or an aligned bearish crossover.
Step-by-step template:
- Context: Identify trend and key levels on a higher timeframe. Divergence against a mature trend or at a major level has more weight than random mid-range signals.
- Spot the divergence: Mark swing points on price and the MACD. Verify that price and indicator peaks/troughs are out of sync.
- Wait for confirmation: Require a break of structure, retest rejection, or a strong reversal candle. Enter on close to reduce noise.
- Manage risk: Set the stop beyond the invalidating swing. Consider scaling out on the first reaction and trail the remainder.
- In strong trends: Divergence can fail repeatedly. If the higher timeframe trend is dominant, fade fewer signals and demand stronger confirmation.
Key risk notes:
- Divergence signals are frequent in consolidations and can produce many false starts. Avoid forcing trades without confluence.
- MACD remains lagging; do not trade divergence without price-based triggers and disciplined stop placement.
MACD Histogram Strategy (MACD Histogram Strategy)
The histogram represents the distance between the MACD Line and the Signal Line. Expanding bars indicate strengthening momentum; contracting bars point to weakening momentum. Traders use this as a momentum gauge rather than a standalone entry engine.
Practical uses:
- Momentum confirmation: During a trend, rising histogram bars that remain on the trend side of zero support continuation. Fading bars warn of potential pullbacks.
- Early momentum shifts: A sequence of lower histogram peaks during an uptrend or higher troughs during a downtrend can precede a crossover. Combine with structure breaks.
- Risk planning: When histogram momentum fades near key levels, tighten stops or take partial profits. Strong, expanding histogram bars can support holding winners—until momentum clearly decays.
Because the histogram is derived from smoothed lines, it still lags price. Use it to confirm trades built on price action and trend, not as a solitary signal.
MACD Trading Strategies by Timeframe
MACD adapts across timeframes, but its reliability varies with market noise. Lower timeframes (1–5 minutes) are noisy and amplify whipsaws; higher timeframes (1H, 4H, Daily) filter noise and generally produce cleaner signals. Align your execution timeframe with a higher-timeframe bias, and always define risk per trade, maximum daily loss, and invalidation zones before acting.
Curious about when the Elirox bot trades and which sessions it covers? See: What are trading hours.
MACD for Scalping and Day Trading (MACD Scalping)
On very small charts, MACD can flip rapidly, producing many false crossovers. For macd scalping, some traders shorten parameters (e.g., 6-13-5 or 8-21-5) to increase responsiveness, but this raises noise. Others keep 12-26-9 and apply stricter filters like session timing, volatility thresholds, and structure confirmation.
Guidelines:
- Market selection: Focus on liquid sessions (e.g., London or New York) and pairs with tight spreads; avoid illiquid hours.
- Filters: Trade only in the direction of a higher-timeframe bias. Require a clean break-and-retest or clear micro-structure shift.
- Entries and exits: Act on candle close after the crossover. Use tight, structure-based stops and predefine take-profit objectives (e.g., fixed R multiples) to avoid overtrading.
- Risk: Keep risk small; a string of small losses is possible in noise. Cap the number of trades per session and stop after reaching daily risk limits.
The priority intraday is not chasing every signal but executing a repeatable plan that enforces confirmation and risk management.
MACD for Swing Trading (MACD Swing Trading Forex)
On 1H, 4H, and Daily charts, MACD tends to be more reliable because trends are clearer and noise is reduced. For macd swing trading forex, many practitioners:
- Establish higher-timeframe bias using zero-line position and price structure.
- Enter on pullbacks that coincide with a favorable crossover or histogram re-acceleration.
- Place stops beyond structural levels and trail behind higher swing pivots.
Approach:
- Look for alignment: Higher timeframe trend up, MACD above zero, and a fresh bullish crossover after a pullback into support.
- Manage positions: Scale in only if the thesis strengthens; scale out into prior highs/lows or when histogram momentum fades.
- Patience: Fewer signals occur, but quality improves. Avoid countertrend trades unless backed by strong divergence at key levels and a clear structure break.
Combining MACD with Momentum and Trend
Using MACD alone can be risky in some conditions. Use it with clear price structure and a consistent trade plan to confirm direction, refine entries, and avoid trading against dominant flows. Confirmation reduces false positives and anchors risk decisions to objective criteria.
Confirmation and Context for MACD (MACD Confirmation Forex)
MACD reflects trend-momentum. Traders often add extra chart context to filter low-quality setups. In MACD confirmation workflows:
- Trend filter: Trade in the direction of the MACD zero-line bias.
- Momentum alignment: Prefer crossovers and histogram expansion that occur with clean follow-through and away from choppy, sideways structure.
- Timing: Consider entering on candle close after a level break or retest. Avoid entries when price is compressing and MACD signals are flipping frequently.
- Exits: Consider partial profits when the MACD histogram contracts for several bars. Exit fully on opposite signals or a break of structure.
Risk principles:
- Do not override stops because indicators still lag.
- Conflicting MACD signals and choppy price action warrant caution—reduce size, wait for price confirmation, or skip the trade.
MACD and Price Action Confirmation
Price action—breakouts, retests, and reactions at support/resistance—offers the clearest context for MACD signals. A structured approach:
- Breakout confirmation: After price closes above resistance, a bullish MACD crossover or histogram acceleration can validate follow-through. Enter on retest acceptance; place stops below the breakout level.
- Trend continuation: In an uptrend, buy pullbacks where price prints a higher low near support while MACD holds above zero or crosses up again. Reverse for downtrends.
- Reversal context: At a well-defined level (monthly/weekly S/R or major channel), combine bearish divergence with a breakdown to time entries. Avoid preempting reversals without price proof.
Execution and risk:
- Define invalidation at the structure level, not the indicator line. If price invalidates the setup, exit regardless of indicator state.
- Position sizing should assume that even confirmed signals can fail in consolidating markets.
- Document rules to prevent discretionary drift during fast moves.
Conclusion: The MACD Strategy for Trend and Momentum
A disciplined macd trading strategy forex uses MACD to confirm trend and momentum—not to predict them. The indicator is lagging by design, so expect entries to follow price rather than lead it. It is most effective in trending conditions and tends to produce false signals in ranges. Improve quality by applying confirmation (price action, levels, and higher-timeframe bias), and by enforcing strict risk management: define stop-loss placement, size positions conservatively, and pre-plan exits.
Whether you trade crossovers, zero-line bias, divergence, or histogram momentum, keep the process consistent and objective. Test your rules, document them, and avoid overfitting settings to past data. Used as a confirmation tool within a coherent plan, MACD can help keep trades consistent with prevailing trend and momentum while maintaining the critical discipline of risk control.
Want to explore automated trading strategies without risking real capital? Start with $10,000 in virtual funds on Elirox: How to use a demo account.
Disclaimer: This article is for educational purposes only and does not constitute financial advice.