What are Bollinger Bands and How Do They Work?
Bollinger Bands are a volatility-based overlay built from a moving average and standard deviation envelopes. The bands expand when price volatility increases and contract when volatility declines. This dynamic width turns the indicator into a two-in-one tool: it signals potential reversals at extremes in range-bound markets and highlights expansion phases that often precede directional trends.
The core logic:
- The middle band is a trend proxy (Simple Moving Average).
- The upper and lower bands represent statistically derived envelopes around the mean (commonly 2 standard deviations).
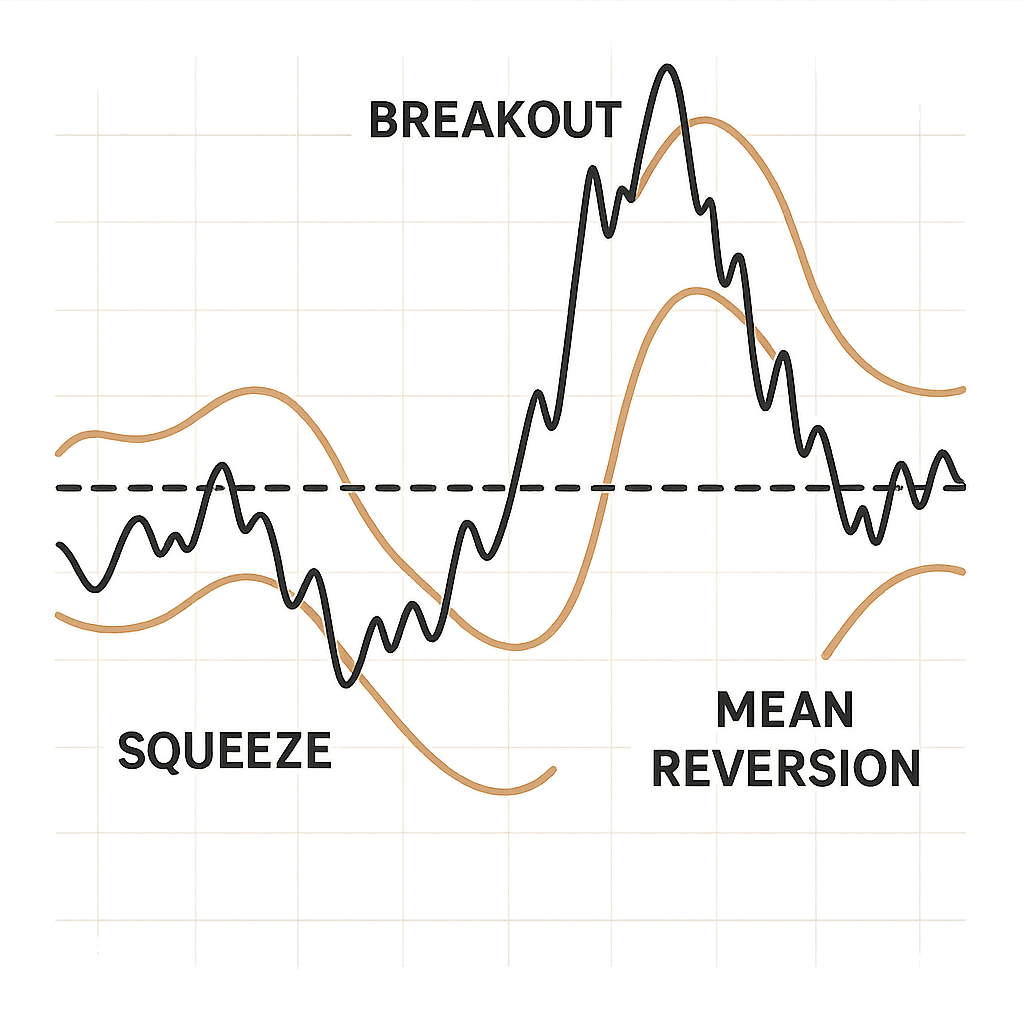
- Contraction (squeeze) can precede expansion (breakout/trend), but direction and follow-through vary. Expansion can cool into consolidation, where mean reversion regains relevance.
Interpretation principles:
- Bands contracting: volatility is compressing; a potential energy build-up.
- Bands expanding: volatility is releasing; the market may be trending or making a sharp directional move.
- Price outside a band: relatively stretched versus recent volatility and often followed by either a quick reversion or an acceleration if a breakout evolves into trend.
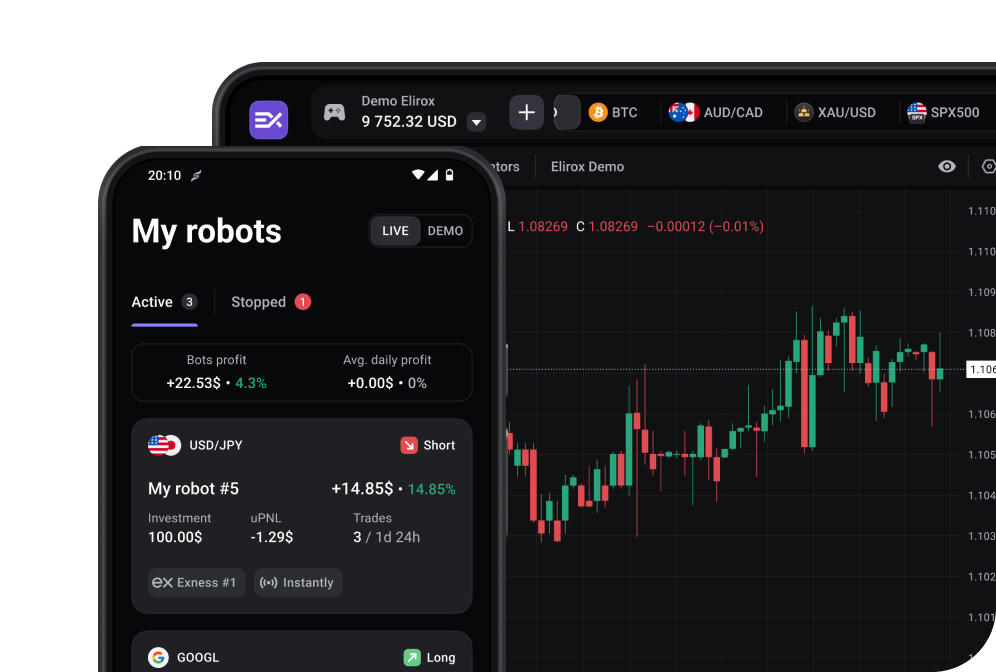
💡 Set Bollinger Bands as your entry trigger — and stop watching charts.
Elirox’s DCA bot supports Bollinger Bands as a built-in entry condition. Define your band parameters, set your position size and risk rules — the bot monitors the market and executes trades automatically. Trade whenever the market is open, no VPS required. Try Elirox for free.
Understanding the Three Components
- Middle Band (SMA): This is typically a 20-period Simple Moving Average of price. It serves as a dynamic mean and a reference for trend direction. Above the SMA leans bullish; below leans bearish.
- Upper Band (+2 Std Dev): Two standard deviations above the SMA. When price tags or briefly closes above the upper band, it signals a short-term extreme. In ranges, that extreme often mean-reverts. In trends, price may “walk the band,” and continued closes near or beyond the upper band indicate persistent buying pressure rather than an automatic reversal.
- Lower Band (-2 Std Dev): Two standard deviations below the SMA. Touches or closes beyond the lower band show downside extremes. As with the upper band, context matters: ranges favor bounce setups, while trends can produce persistent band riding.
Standard Bollinger Bands Settings (Bollinger Settings Forex)
The standard “bollinger settings forex” baseline is a 20-period SMA with bands at 2 standard deviations, applied to the closing price. This combination balances responsiveness and noise filtering on many currency pairs and timeframes.
Adjustment guidelines:
- Shorter period (e.g., 10) or fewer deviations (e.g., 1.5) makes bands more sensitive—useful for fast scalping, but with more false signals.
- Longer period (e.g., 50) or wider deviations (e.g., 2.5) smooths noise—useful for swing trading and for filtering out minor fluctuations.
- Always test settings per pair and timeframe. Liquidity and typical volatility differ across majors, crosses, and exotics.
Critical reminders:
- Do not treat Bollinger Bands as a standalone signal in all conditions. Use price structure cues (e.g., break-and-retest) and, when available, additional chart-based contex
- In trends, price can hug an outer band. Avoid countertrend triggers based solely on a band touch; require confirmation.
- Use a stop-loss with every trade. False breaks and volatility spikes occur routinely in forex.
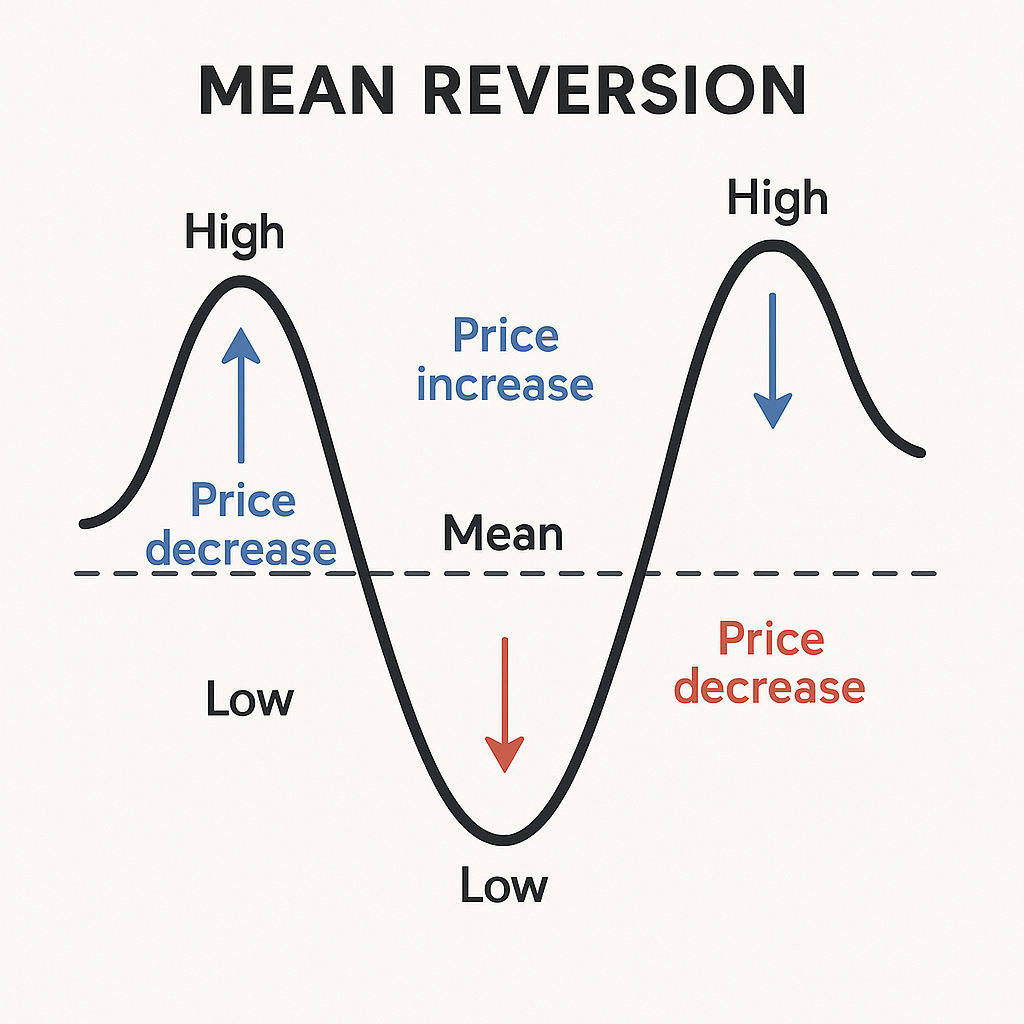
Bollinger Bands Mean Reversion Strategy (Mean Reversion Forex)
The “bollinger bands mean reversion forex” approach aims to buy near the lower band and sell near the upper band when the market is ranging. The idea is that extremes relative to the mean often attract reversion, especially when volatility is subdued and a clear horizontal structure exists.
Core conditions:
- Ranging environment: Identify horizontal support/resistance zones framing price. Look for flat or gently sloping middle band (SMA).
- Confirmations: Use price behavior at the bands (rejection candles, failed pushes, and respect of range boundaries) to support a range thesis.
- Risk management: Use tight but logical stops beyond swing points or just outside the band to cap downside when ranges break.
Trading the Bounce Off the Bands
Entry logic in ranges:
- Buy near the lower band when price shows rejection (e.g., pin bar, engulfing) and a confirming oversold signal (e.g., RSI near 30 with bullish divergence).
- Sell near the upper band on bearish rejection and overbought confirmation (e.g., RSI near 70 with bearish divergence).
- Avoid trades if the middle band slopes strongly or if ADX is rising above typical trend thresholds (e.g., >20–25), as range conditions may be ending.
Stop-loss and trade management:
- Place stops a few pips beyond the recent swing high/low or just outside the band that price rejected.
- Consider partial profits at the middle band; let the remainder target the opposite band if range integrity holds.
- If price closes beyond a band decisively, exit: the range thesis is likely failing.
Targeting the Middle Band
- Take profit at or just before the middle band to realize the core mean-reversion edge.
- If momentum is strong into the mean, you can scale out: close a portion at the middle band and trail the remainder toward the opposite band using a moving stop (e.g., below minor higher lows for longs).
- Treat the middle band as dynamic support/resistance. If price flips the middle band and holds, it can signal a momentum shift—reduce exposure or flip bias if confirmations support it.
Trading Volatility with Bollinger Bands
Volatility trading focuses on the transition from contraction to expansion. The squeeze highlights potential energy; the breakout reveals release. Since direction after a squeeze is uncertain, pair the bands with momentum confirmations (e.g., MACD cross/expansion) or trend strength indicators (e.g., ADX rising). Use a stop-loss on every trade; false breaks are common.
| Strategy | Market condition | Entry trigger | Stop-loss | Take-profit | Confirmation/notes |
|---|
| Squeeze Breakout | Low volatility, contracting | Candle close beyond band after squeeze | Beyond opposite band or recent swing | Initial: middle band retest; Extension: trend ATR | Use MACD/ADX for direction; watch retest for safer entries |
| Trend Continuation | Expanding, strong momentum | Pullback to middle band holds, continuation candle | Below pullback low / above pullback high | Next swing high/low; trail under higher lows | Price can walk the band—avoid countertrend entries |
| Mean Reversion Bounce | Ranging, flat middle band | Rejection candle at outer band with OB/OS confirmation | Outside the touched band or beyond swing | Middle band first; opposite band if range intact | Confirm range structure; avoid when ADX rises |
| Failed Breakout (Fade) | Breakout lacks follow-through | Re-entry inside bands after outside close (failure) | Beyond failure candle high/low | Middle band; opposing band if reversal accelerates | Higher risk—require strong reversal candle and momentum loss on MACD |
The Bollinger Squeeze Strategy (Bollinger Squeeze Strategy)
A squeeze occurs when the bands contract markedly, reflecting low volatility. This phase often precedes a directional expansion. The goal is to anticipate a move from contraction to expansion while managing uncertainty about direction.
Identification:
- Visual narrowing of upper and lower bands around the SMA.
- BandWidth indicator at or near recent lows (discussed in the band width strategy section).
- Diminishing range size and muted momentum readings.
Execution approaches:
- Breakout close approach: Wait for a candle close outside an outer band after the squeeze. Enter in the breakout direction, preferably after a brief retest of the band or broken structure.
- Pending orders approach: Place stop orders a few pips beyond each band during the squeeze. Cancel the opposite order once one triggers. This method requires strict risk controls.
Direction and confirmation:
- Use MACD histogram expansion or a signal-line cross in the breakout direction.
- Use ADX rising from low levels to confirm emerging trend strength.
- Price action confirmation via break-retest of a recent micro-structure (e.g., range high/low) improves odds.
Risk management:
- Place initial stops beyond the opposite band or the squeeze structure’s opposite edge.
- Size positions small; volatility expansion can be abrupt. Scale out as the move matures.
Trading the Breakout (Bollinger Breakout Forex)
A “bollinger breakout forex” setup is validated when price closes outside a band with momentum. This indicates volatility expansion and potential trend initiation or continuation.
Typical plan:
- Entry: After a clean close beyond the band, consider entering on a minor pullback that fails to re-enter the bands (break-and-go) or on a retest of the breakout level.
- Confirmation: Look for clean follow-through (continuation closes, limited re-entry into the bands) and alignment with nearby structure (range highs/lows). Do not rely solely on a band close.
- Stop-loss: Place below/above the retest swing or just beyond the middle band on aggressive entries; conservative stops go beyond the opposite band.

Management:
- First target at 1R or near the prior swing/micro-structure; trail under/over higher lows/higher highs as the move develops.
- Expect pullbacks to the middle band in trends; these can offer add-on entries if momentum persists.
Common pitfalls:
- Jumping on the first tick outside a band without a candle close.
- Ignoring higher-timeframe levels where breakouts often stall.
- Failing to use a stop-loss in fast markets.
Introducing the Band Width Strategy
BandWidth quantifies the distance between the upper and lower bands relative to the middle band. It is commonly defined as (Upper − Lower) / Middle × 100. In practical terms, lower BandWidth values indicate squeezes; increasing values indicate expansion. A band width strategy integrates this reading to systematize volatility phases.
How to use:
- Identify squeezes: Track multi-week or multi-day BandWidth lows on your timeframe. When BandWidth hits a percentile low (e.g., the lowest 10–20% of readings over N bars), prepare for a breakout protocol.
- Triggering: Combine a BandWidth low with a price close outside a band. For directional bias, prioritize follow-through and break-and-retest behavior around the squeeze structure.
- Managing risk: During squeezes, use modest position sizes; expansion phases can gap through levels on fast pairs. Stop-loss should sit beyond the opposite band or the consolidation boundary.
Advanced Bollinger Bands Strategies
Advanced applications refine entries, define trade zones, and strengthen confirmations. Keep reinforcing the core rule: do not use one indicator. Combine the bands with momentum, strength, and structure analysis, and always place a stop-loss.
Double Bollinger Bands Strategy
The double bollinger bands strategy layers two sets of bands on the same chart, typically:
- Inner bands at 1 standard deviation.
- Outer bands at 2 standard deviations.
Practical zone reading:
- Momentum zone: Price closing and holding between the middle band and the +1 SD (for longs) or −1 SD (for shorts) indicates constructive momentum. Pullbacks that stay within this inner zone can be continuation entries.
- Exhaustion/acceleration zone: Tags or closes beyond the 2 SD bands indicate extremes. In strong trends, riding the area between +1 SD and +2 SD (or −1 SD and −2 SD) shows trend health; fading solely on an outer-band touch is risky without reversal evidence.
Execution guidelines:
- Trend entries: Buy pullbacks that respect the +1 SD in an uptrend; stop below the middle band or recent swing. Reverse logic for downtrends.
- Reversion attempts: Only consider countertrend fades beyond 2 SD with clear reversal candles and momentum loss (e.g., MACD divergence). Prioritize range contexts.
Confirmation Strategy: Bollinger Bands and RSI (Bollinger + RSI Forex)
In a bollinger + rsi forex framework, the bands identify extremes while RSI contextualizes momentum:
- Overbought/oversold: Band touch with RSI >70 or <30 can support a bounce in ranges. Require a reversal candle or structure break for entry.
- Trend bias: Use RSI 50 as a directional filter—above 50 favors long setups on middle-band pullbacks; below 50 favors shorts.
- Divergence: If price makes a higher high beyond the upper band while RSI prints a lower high, that negative divergence warns of momentum loss; pair with reversal candles or a re-entry into bands to time exits or countertrend trades.
Risk considerations:
- In trends, RSI can remain overbought/oversold for long periods—do not countertrend solely on RSI and band touch.
- Place stops beyond structure, not just beyond the band.
Applying Bollinger Bands to Different Timeframes
Timeframe choice influences signal reliability, speed, and trade management. Shorter timeframes provide more signals and more noise; longer ones provide fewer but generally cleaner opportunities. Align setups with a higher-timeframe trend filter when possible, and maintain consistent risk per trade across timeframes.
Bollinger Bands for Scalping and Day Trading (Shorter Timeframes)
For intraday and scalping approaches, session timing matters — trading hours differ by broker, so confirm your active window before planning intraday setups.
- Settings and structure: Consider a slightly shorter period (e.g., 10–20) to capture intraday rhythm. Liquidity windows (London/NY overlap) usually favor breakouts; off-hours can favor range fades.
- Scalping mean reversion: Fade band touches when the middle band is flat and ADX is low. Confirm with quick RSI extremes and reversal micro-structure (e.g., a 1–2–3 pattern). Tight stops just beyond the band; target the middle band and exit quickly.
- Scalping breakouts: During squeezes on 1–5 minute charts, wait for a full candle close outside the band plus a micro retest. Stops beyond the opposite band or micro swing; partials at 1R and trail aggressively.
Day trading considerations:
- Spread and slippage matter; pick pairs with tight spreads during active sessions.
- News: Stand aside near high-impact releases; volatility can invalidate signals and widen spreads.
- Avoid treating band touches as automatic entries; prioritize session highs/lows and clear price structure around the bands.
Bollinger Bands for Swing Trading (Longer Timeframes)
- Mean reversion: Fade extremes at outer bands only within well-defined ranges or at major higher-timeframe levels. Confirm with weekly/daily structure and RSI signals.
- Trend continuation: Use pullbacks to the middle band as primary entries, with stops beyond the pullback swing. Add on if price holds between the middle and +1 SD (or −1 SD in downtrends).
- Management: Trail behind swing lows/highs or use ATR-based stops. Event risk (central bank decisions) can create gaps; size conservatively and keep a protective stop in place.
Conclusion: Capturing Trends and Reversals with Bollinger Bands
A disciplined bollinger bands forex strategy balances two complementary edges: mean reversion in ranges and breakout/trend participation during volatility expansion. Use the standard 20, 2 settings as a starting point, adapt to timeframe and pair, and let the middle band guide targets and trend context. Do not use one indicator—confirm with MACD, ADX, or RSI, and respect higher-timeframe structure. In squeezes, direction is uncertain; rely on momentum confirmations and wait for candle closes beyond bands or break-retest patterns. Always place a stop-loss to contain false breakouts and sudden volatility.
Applied consistently, Bollinger Bands can help you frame risk, systematize entries around squeezes, breakouts, and mean reversion, and manage trades with clear references to the middle and outer bands. Before trading live, test your setup on a demo account — Elirox offers $10,000 in virtual funds to validate your approach risk-free.
Disclaimer: This article is for educational purposes only and does not constitute financial advice.